Jan 2024 · Before
A dry summer
in central Chile.
From space, the Valparaíso coast looks calm. Theyt's calendar already showed that February is the month that burns most in the area.
 THEYT
Open the map
Chile and Argentina today · Latin America next
Theyt turns what satellites see into answers for people on the ground: what is burning now, where it is heading, how to get there, and whether this season is worse than normal.
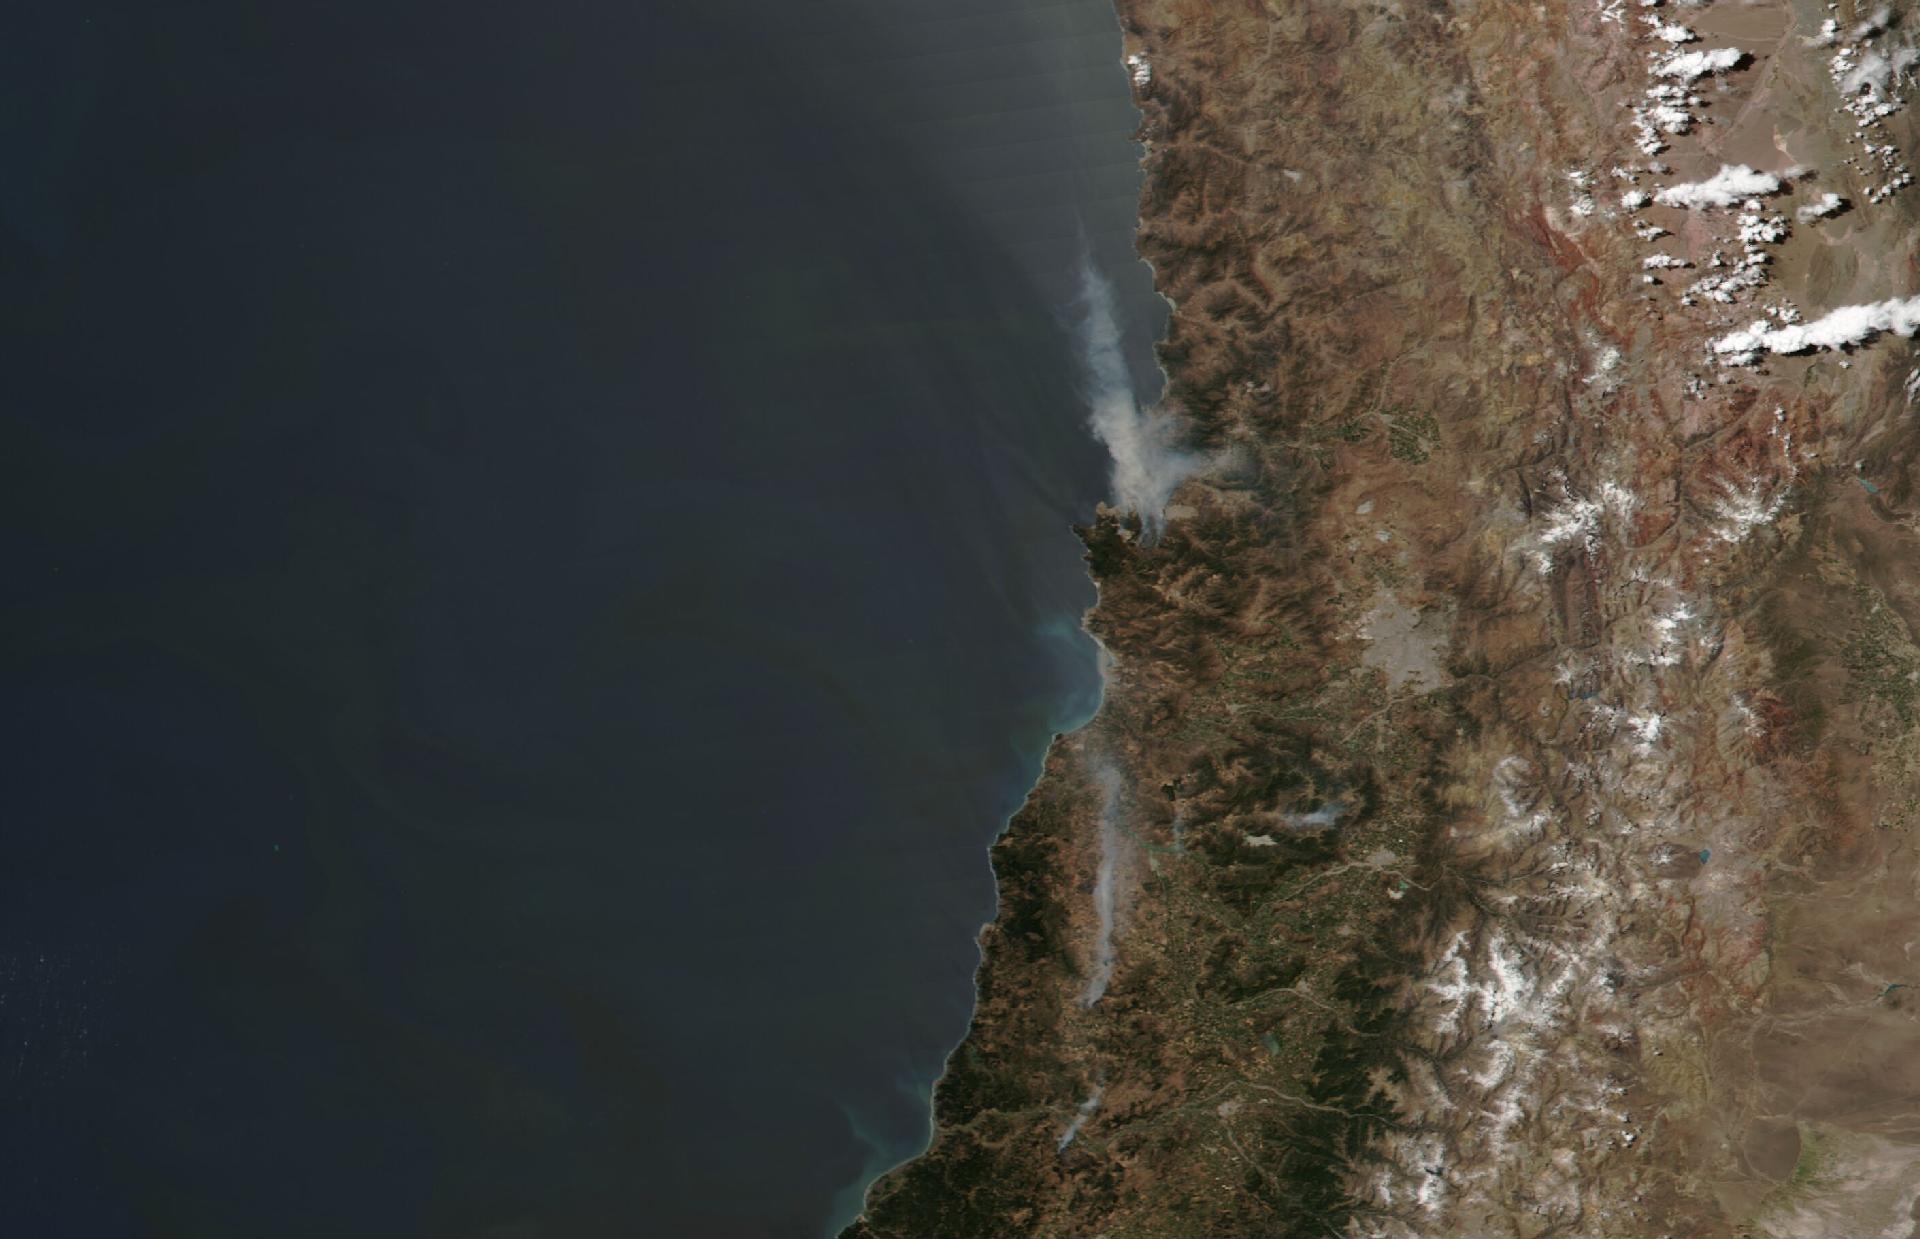
VIIRS · Suomi NPP · 3 Feb 2024 · smoke from Viña del Mar over the Pacific · NASA GIBS
Our purpose
Theyt is not another map of dots. It has its own engine that reads every satellite pass and tells you which dots are real fires, where they could go and how today compares with 25 years of history. Firefighters, families and planners read the same picture.
Live fires sorted by our engine, spread and fastest route for firefighters, reports from people on the ground, an assistant that answers in plain words and the memory of the region's biggest fires.
The same engine for every country in the region, working hand in hand with fire brigades and local communities.
Satellites see the whole planet every day. Wherever there is fire, Theyt can turn it into answers.
The problem
Every day, NASA satellites flag thousands of hot spots. But responders need to know whether the fire is real, where it is heading, how long it takes to get there and whether this month is worse than normal.
And the history is split in two: the older satellites and the newer ones count fire differently, so last year cannot be fairly compared with twenty years ago, just when fires are becoming more frequent and intense.
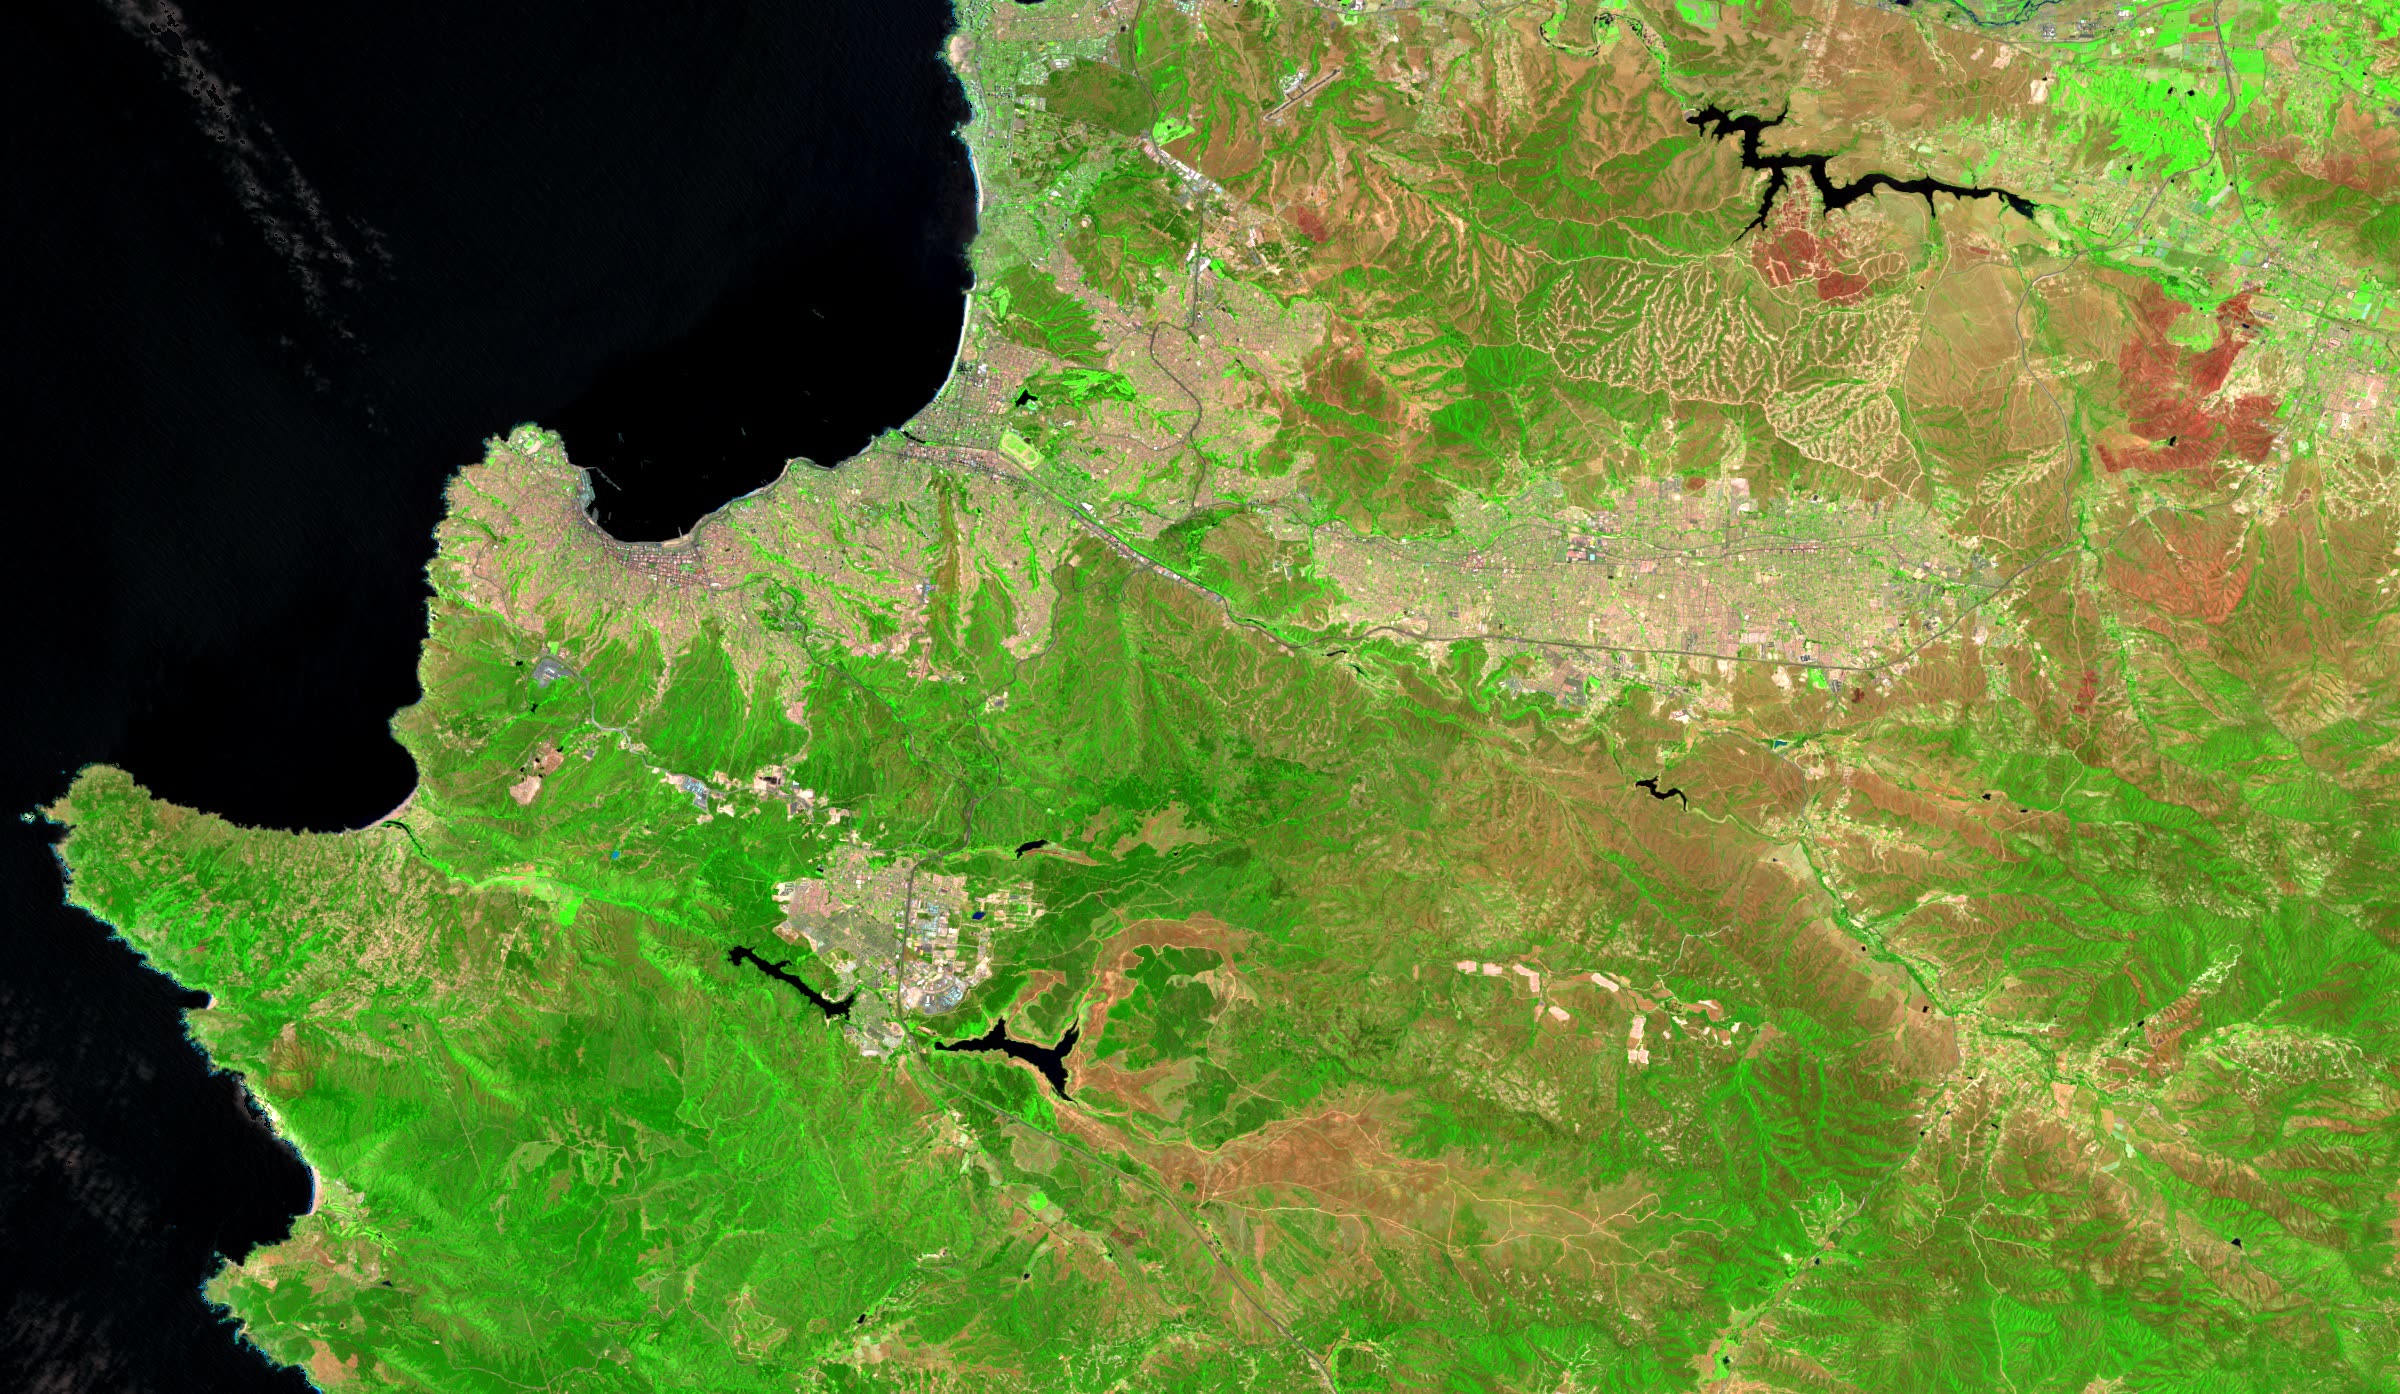
Jan 2024 · Before
From space, the Valparaíso coast looks calm. Theyt's calendar already showed that February is the month that burns most in the area.
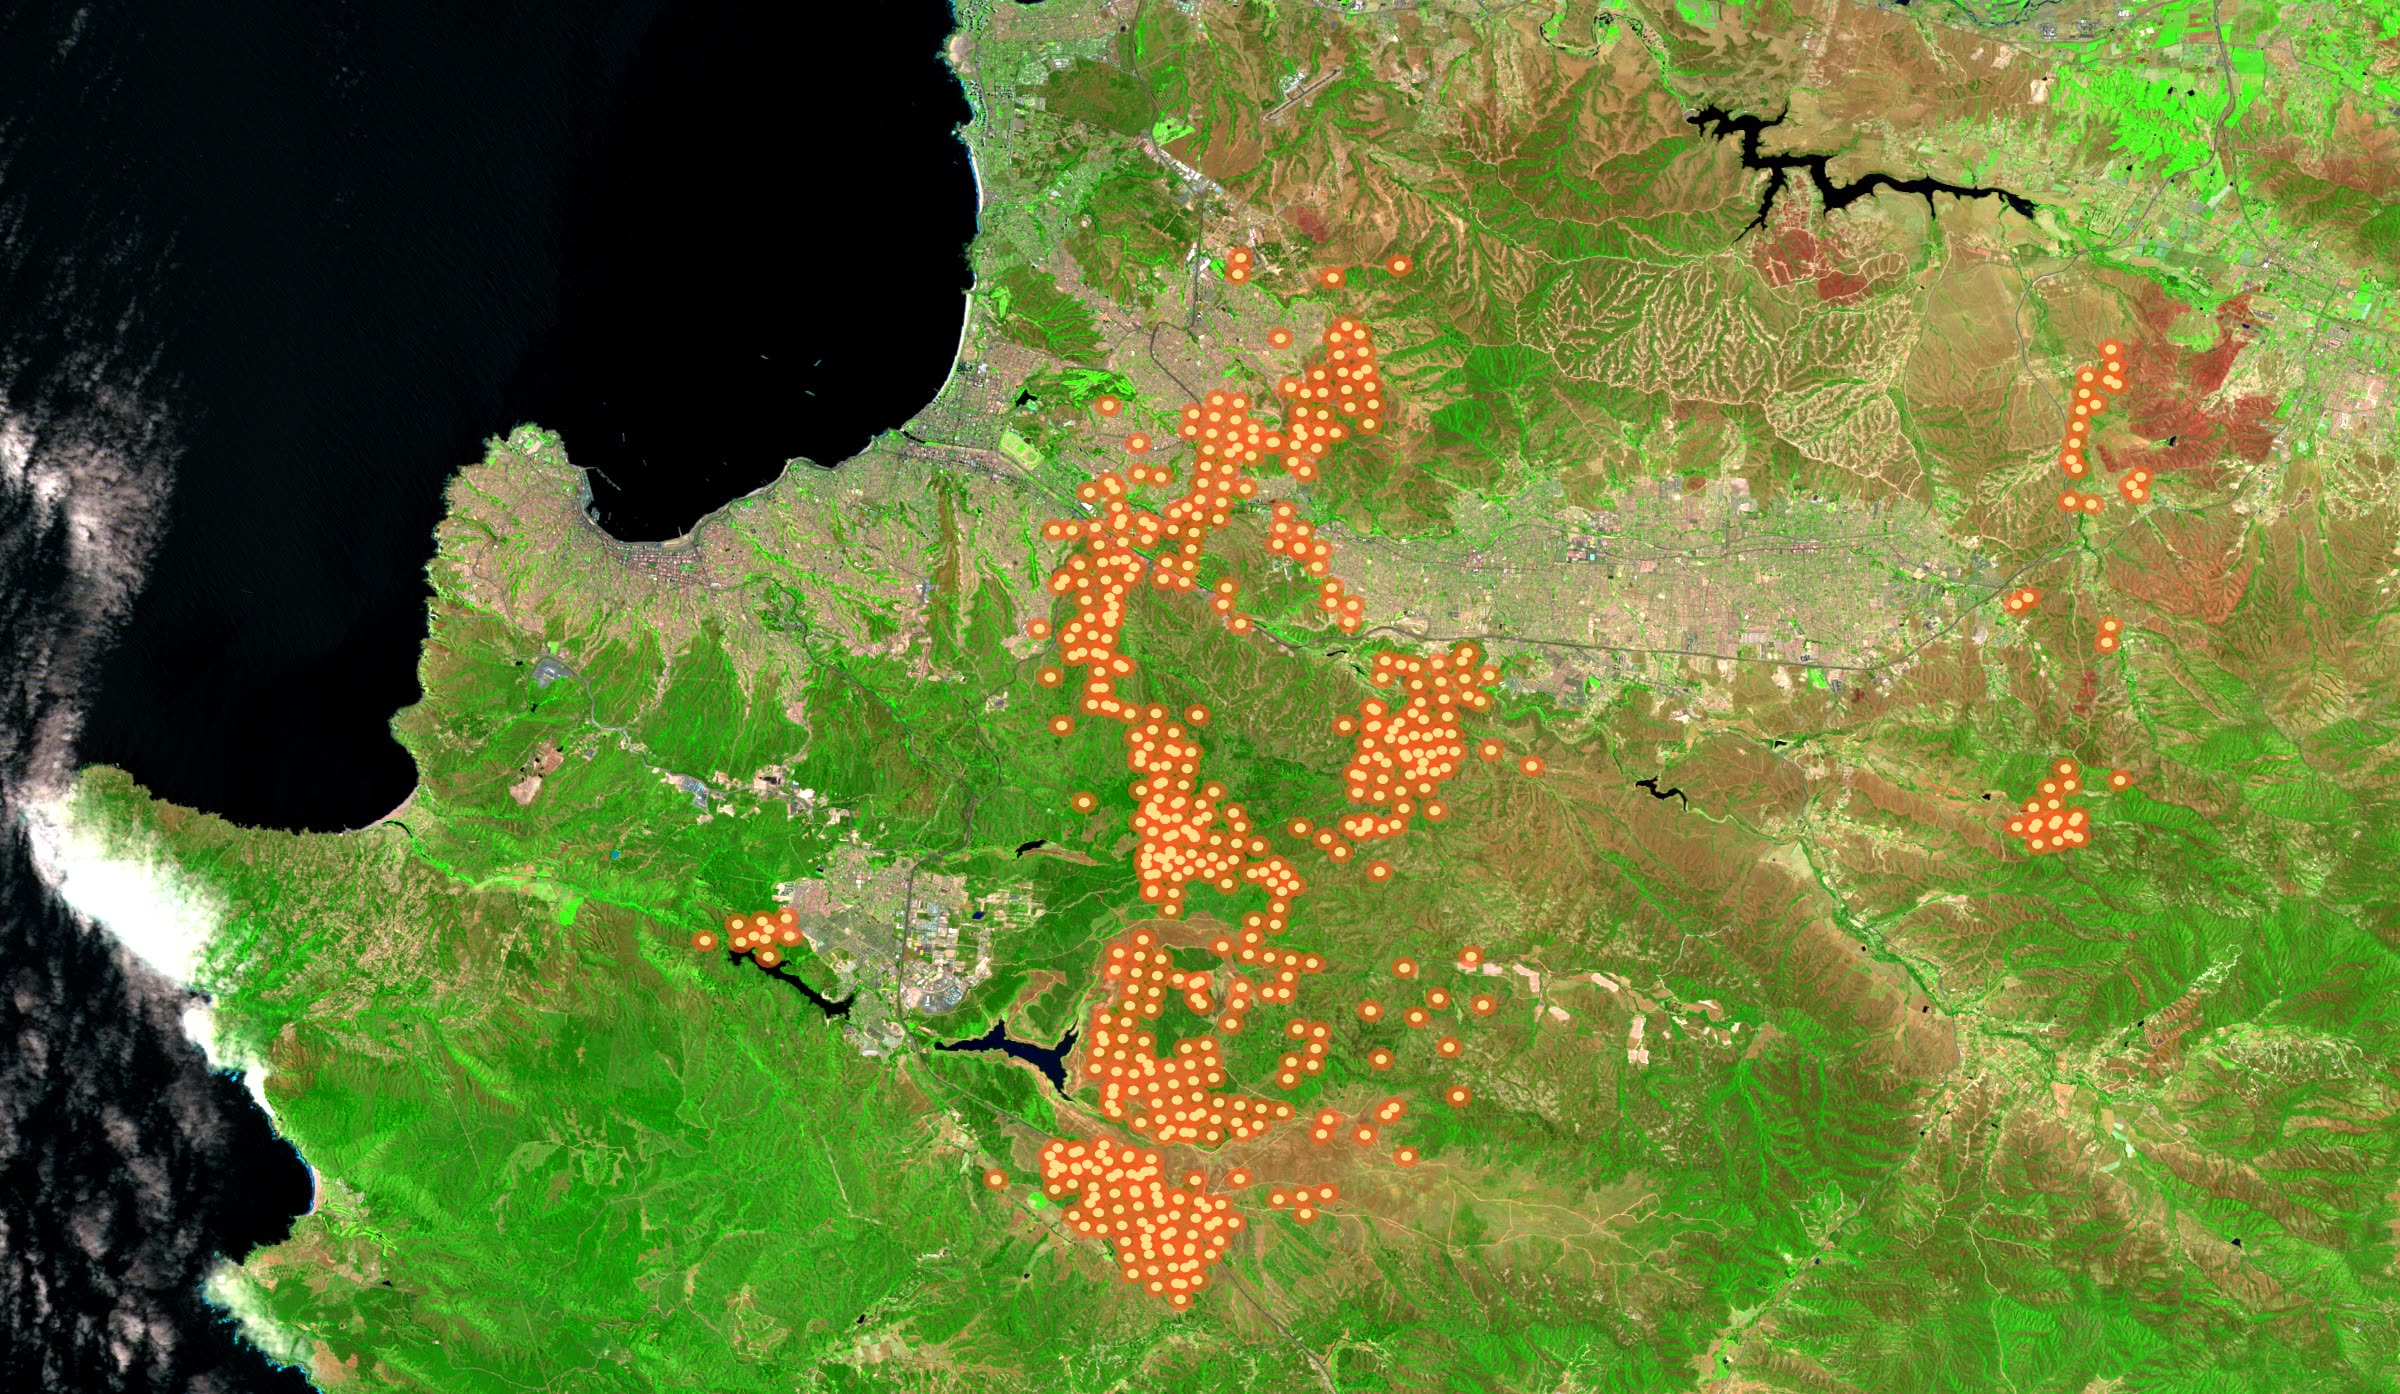
2–3 Feb 2024 · During
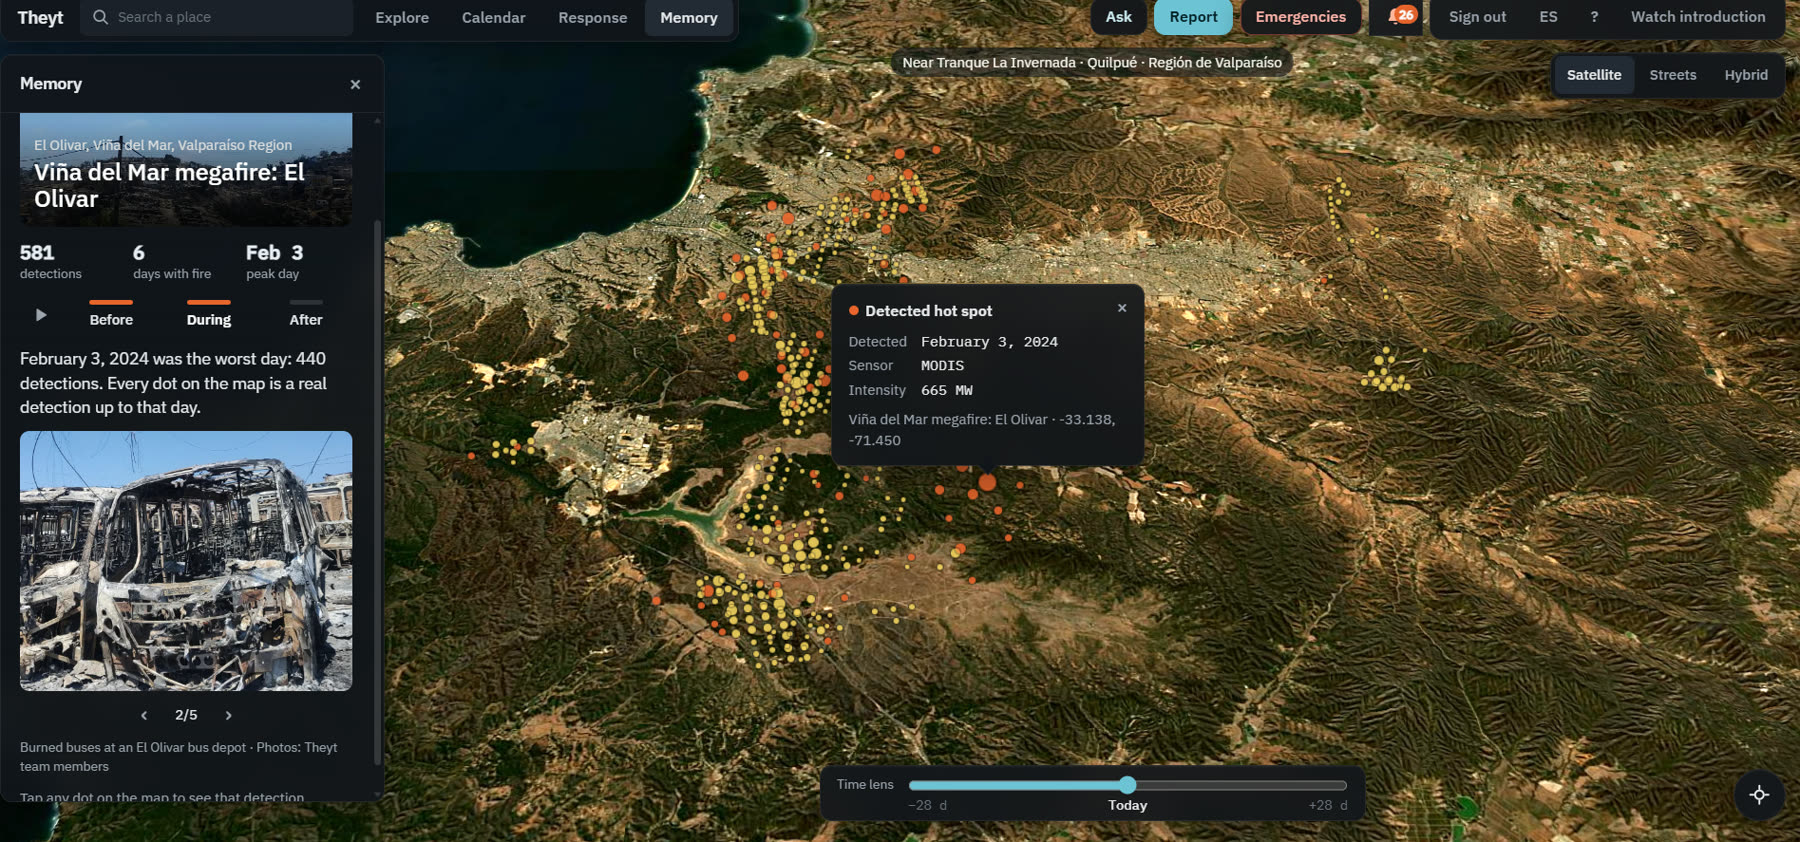
Each glowing dot is a real satellite detection from that afternoon and night, over the sharp image of that same morning. Two satellites saw the same fire, so Theyt marks it as confirmed and shows where it could go next.
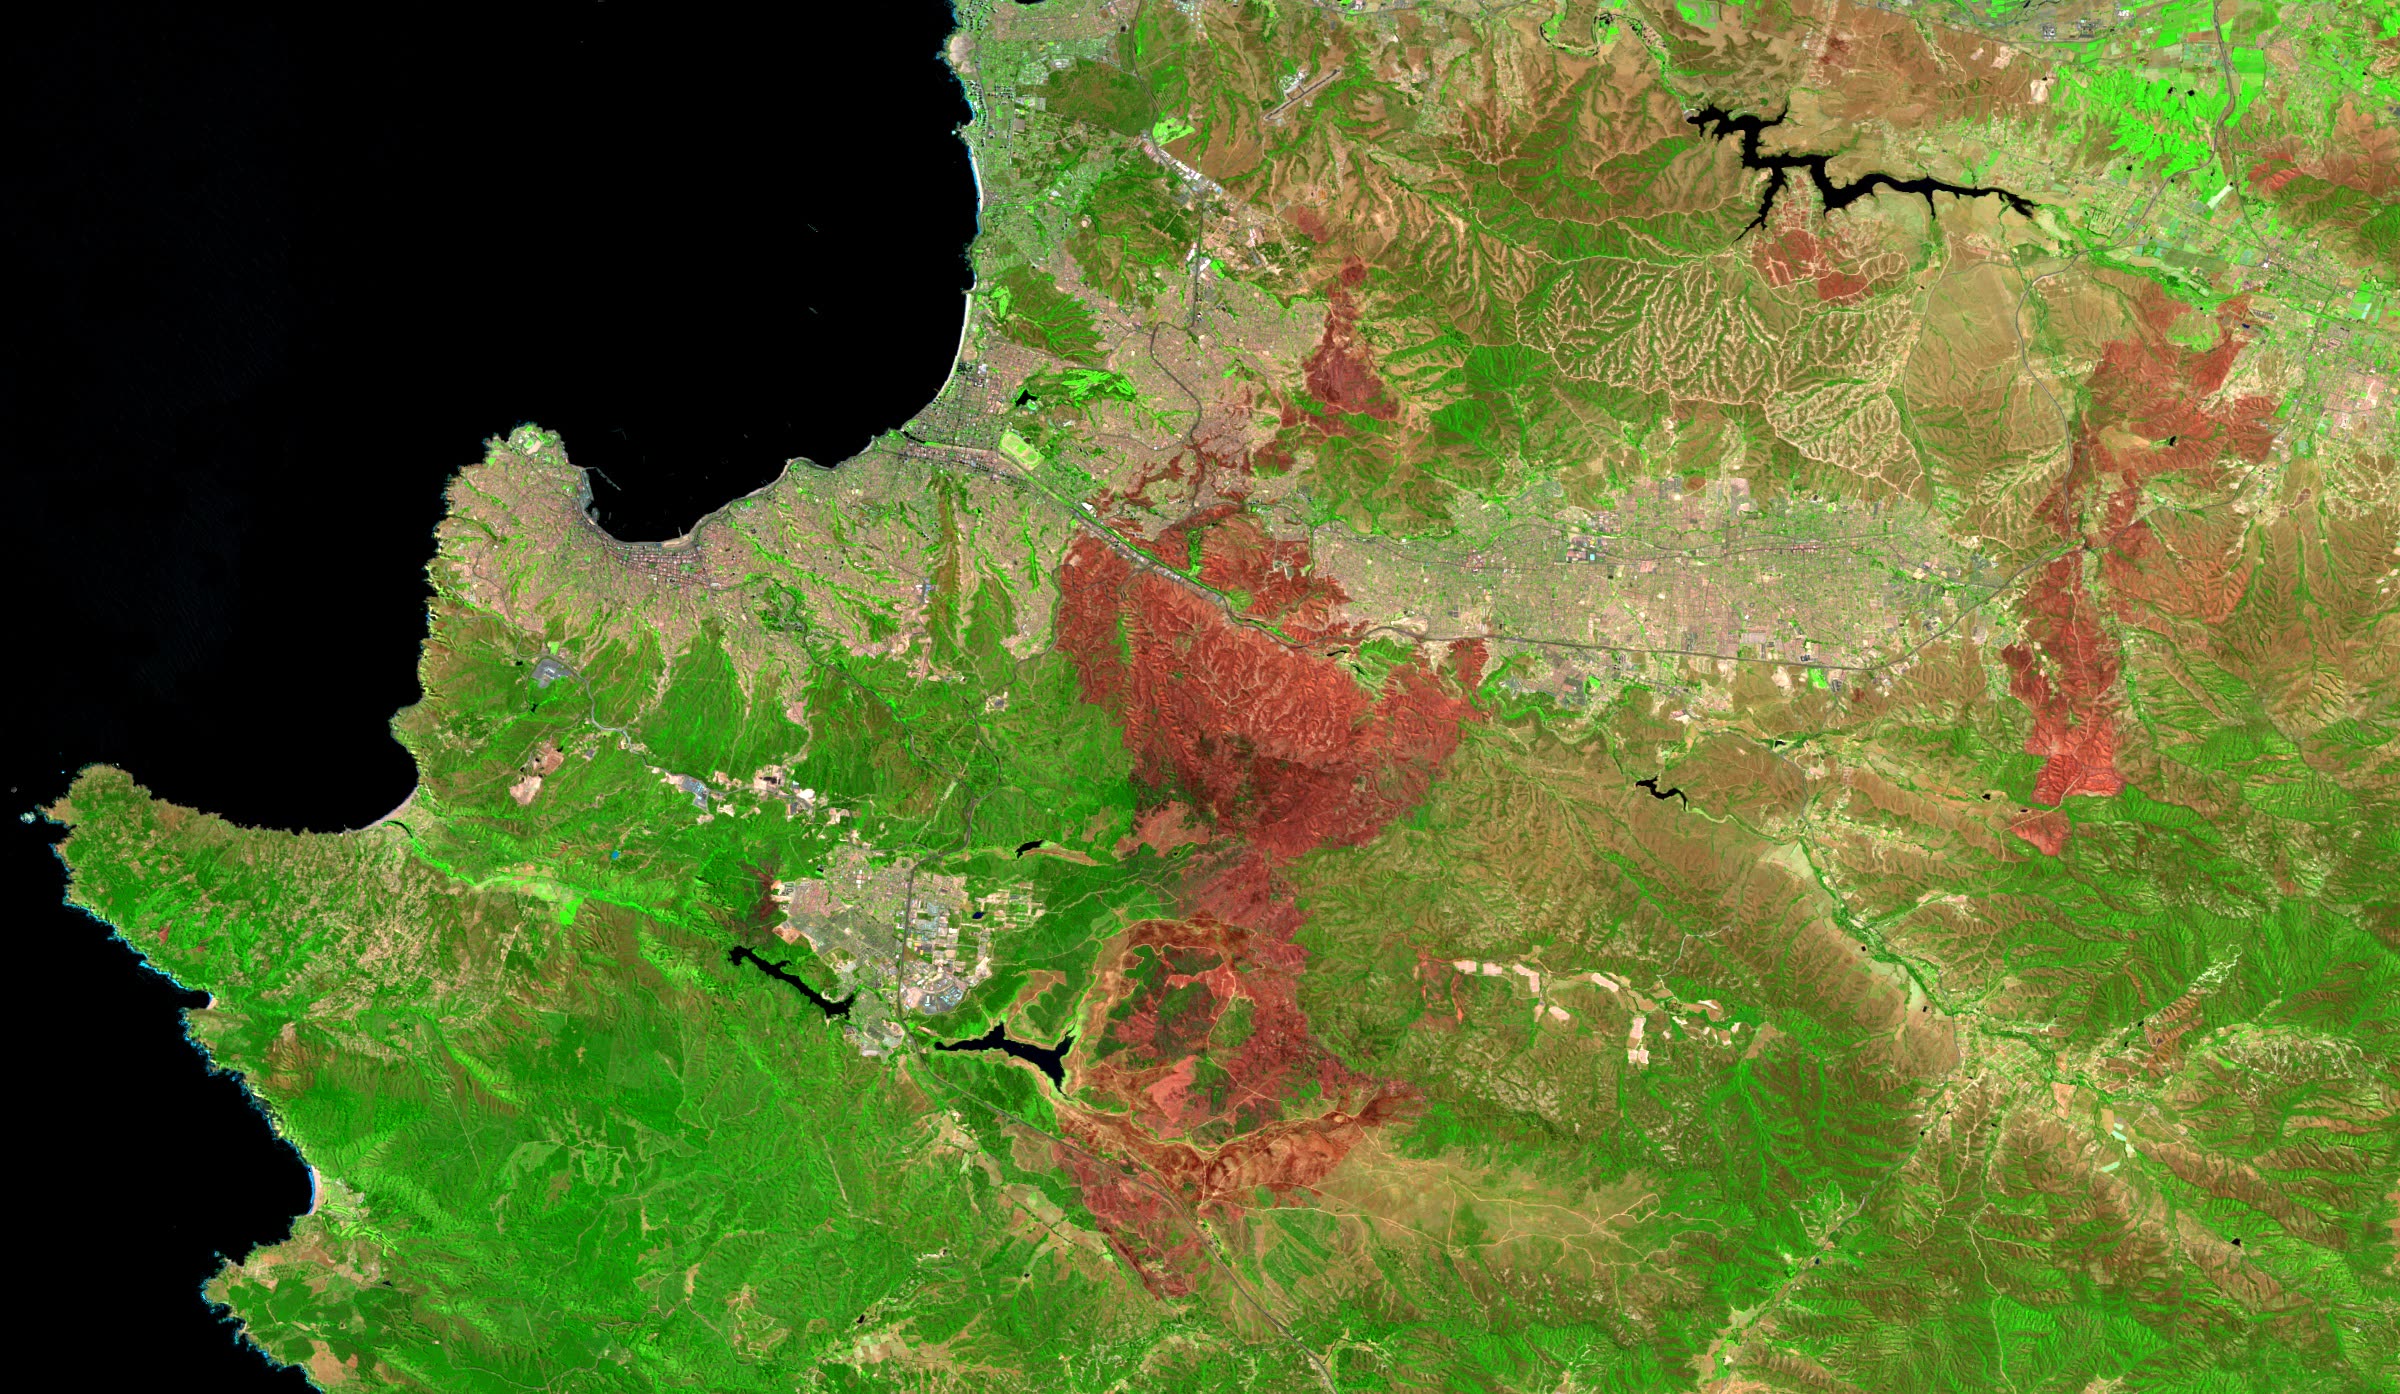
Feb–Mar 2024 · After
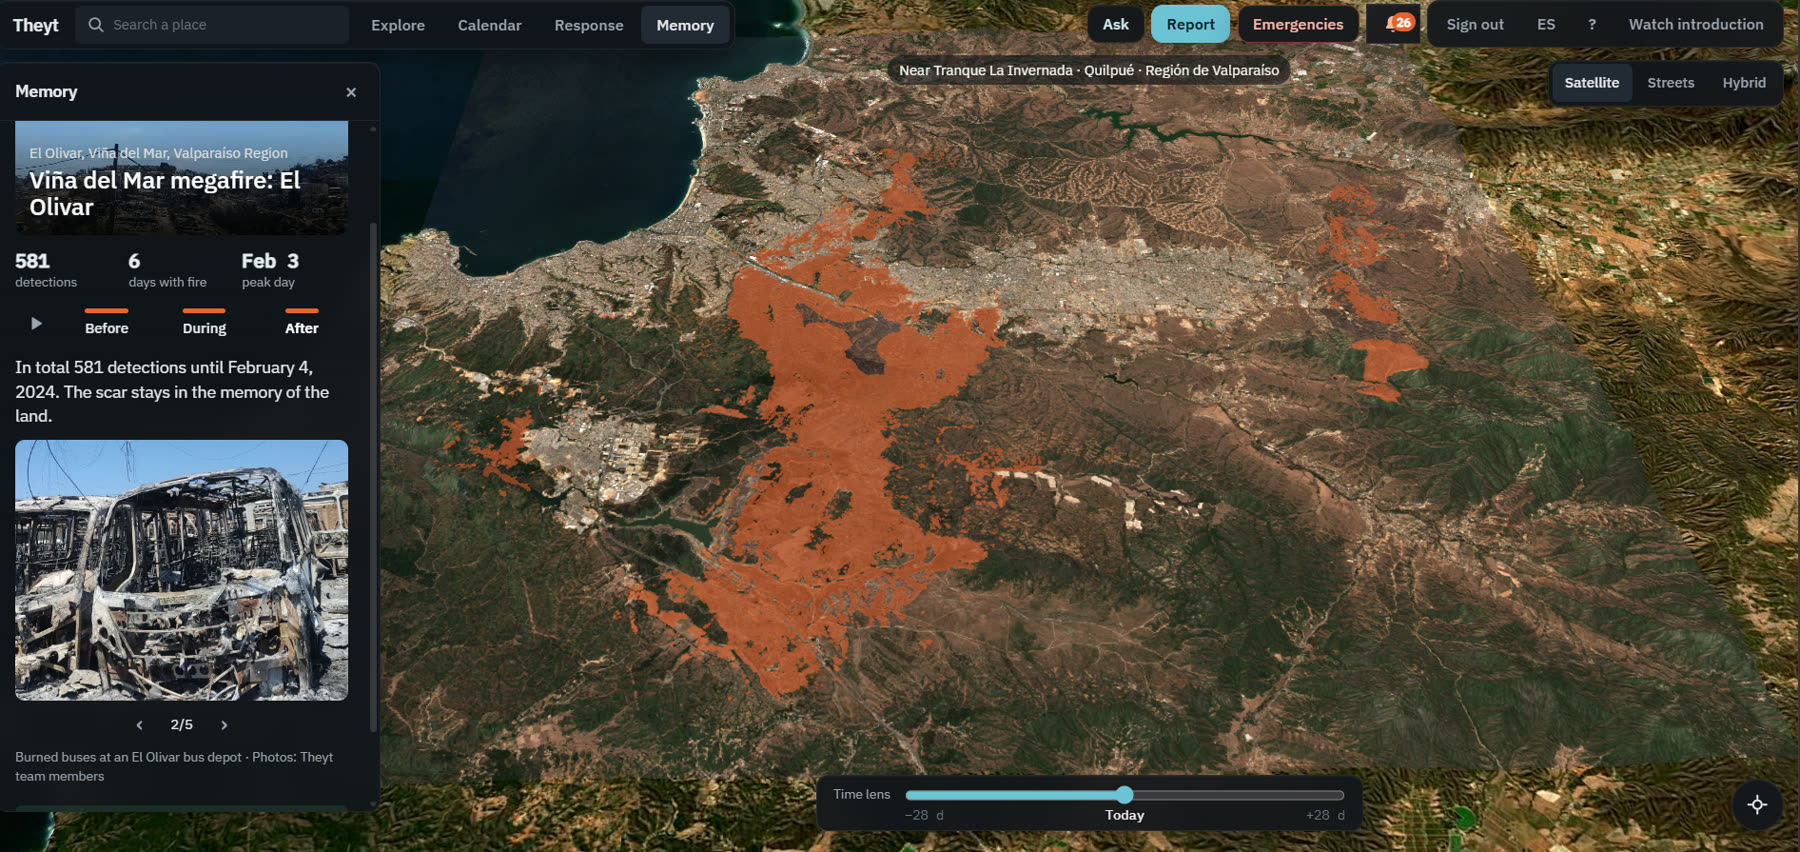
From space, the burned land shows reddish. Theyt measures it: about 8,000 hectares, close to the official figure.
Who we help
One tool for three kinds of users: researchers who need a fair 25-year record, everyday people who live near the forest, and firefighters who work the fire in the field.
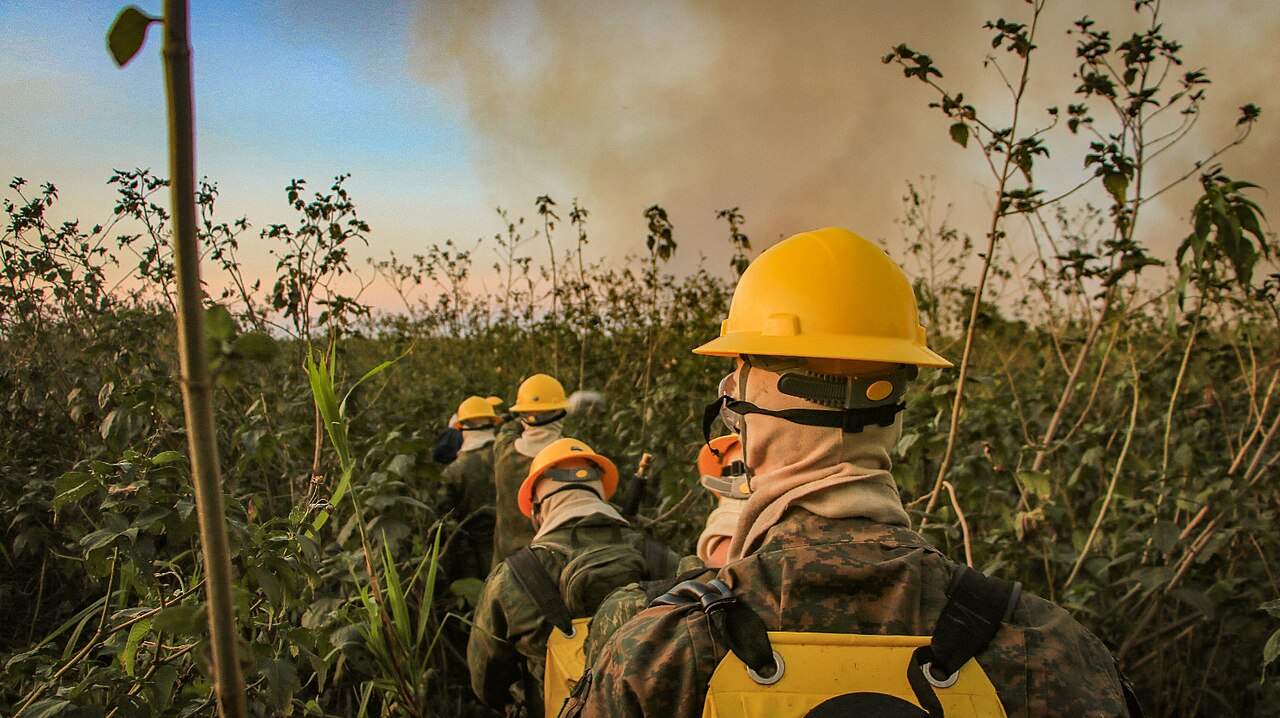
01 · Firefighters · Respond
In the first hour every minute counts. Theyt puts on one screen what a crew needs to decide.
Marinha do Brasil · CC BY-SA 2.0 · Wikimedia Commons
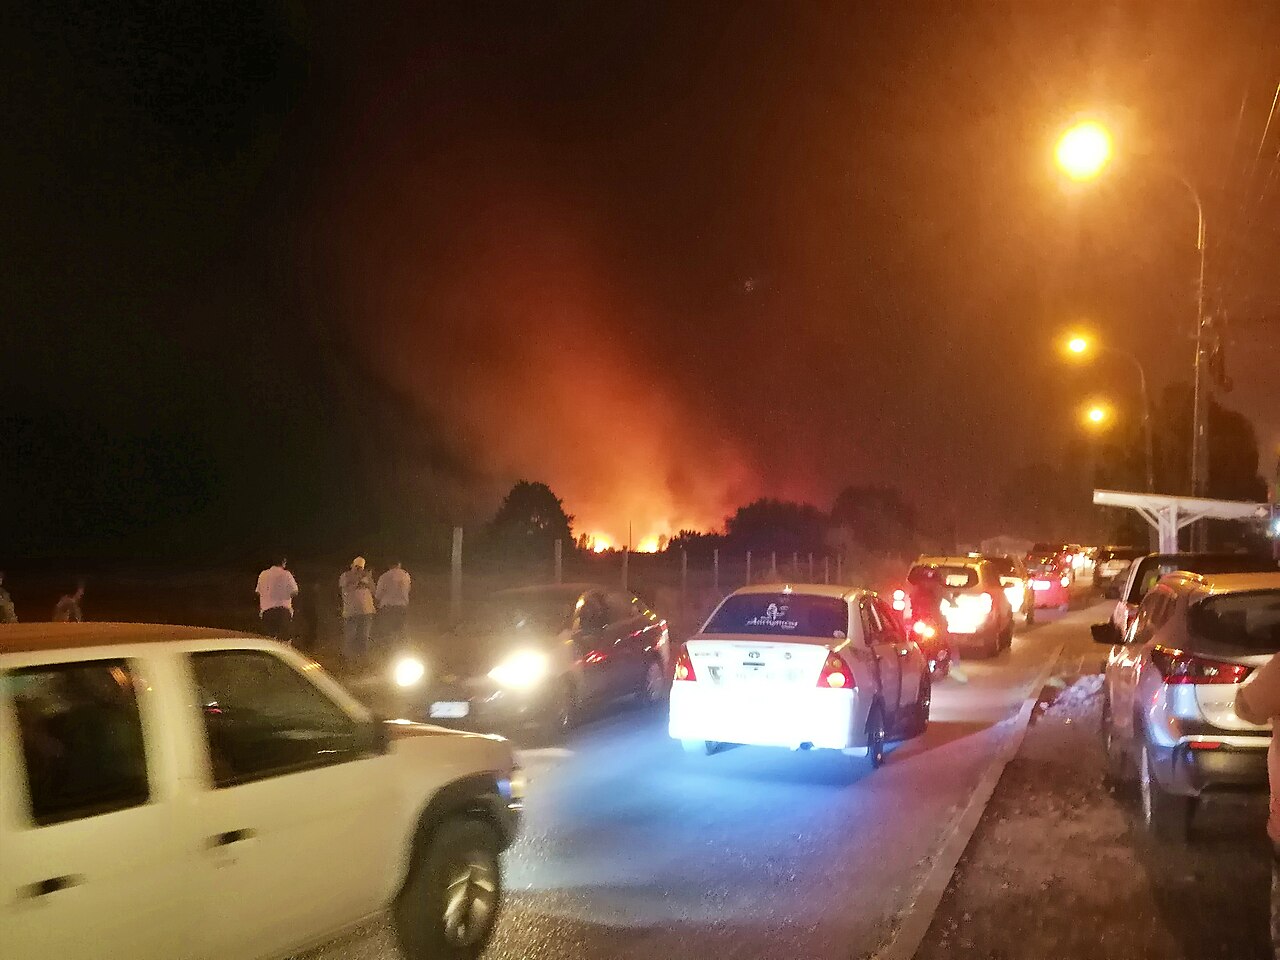
02 · People · Protect
Families living next to the forest deserve the same information as the command post, in plain language.
José Joaquín Cortes · CC BY-SA 4.0 · Wikimedia Commons
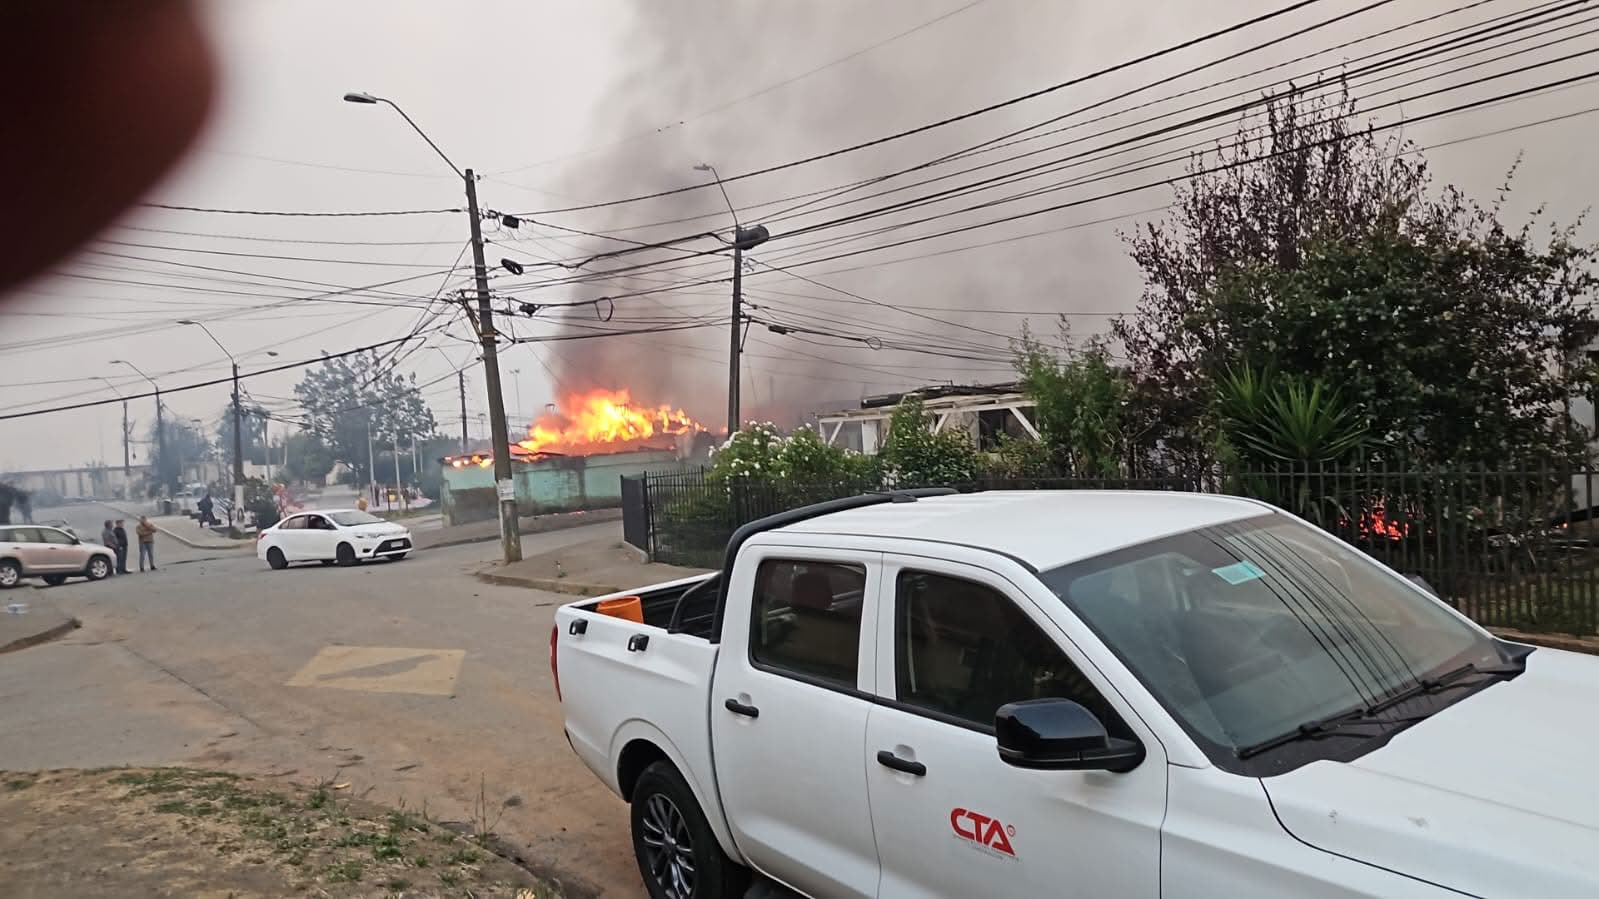
03 · Citizen reports · Fill the gaps
Satellites pass a few times a day. Neighbors see smoke the moment it starts.
Penco, 17 Jan 2026 · Theyt team
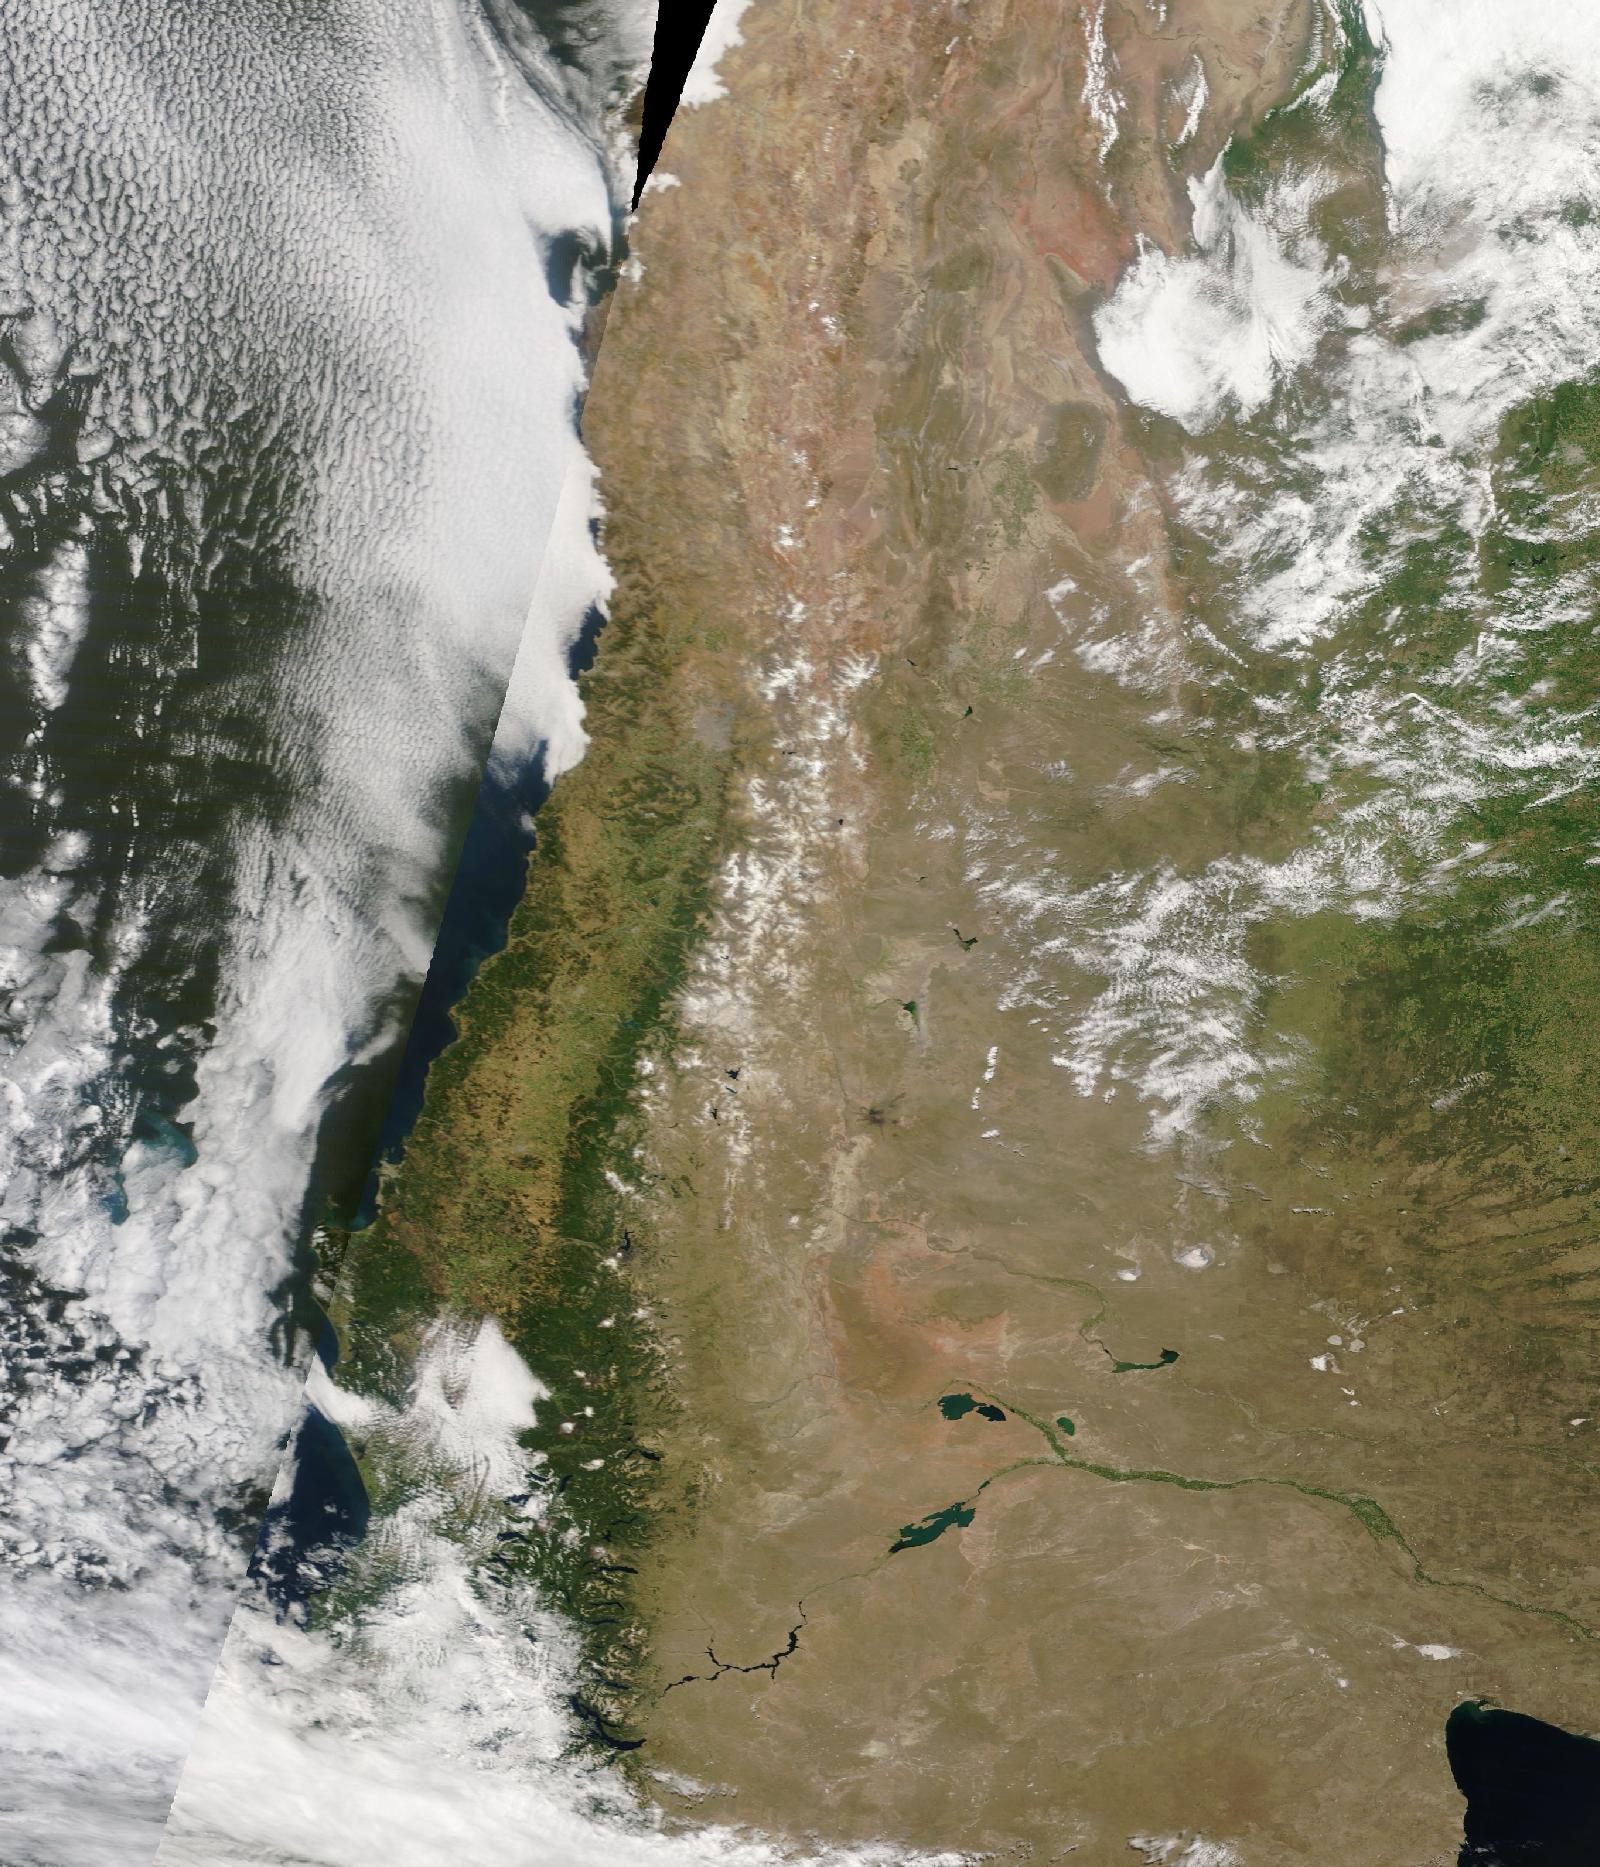
04 · Planners and scientists · Prepare
Brigades, budgets and prevention campaigns depend on knowing when and where fire concentrates.
NASA GIBS · MODIS true color
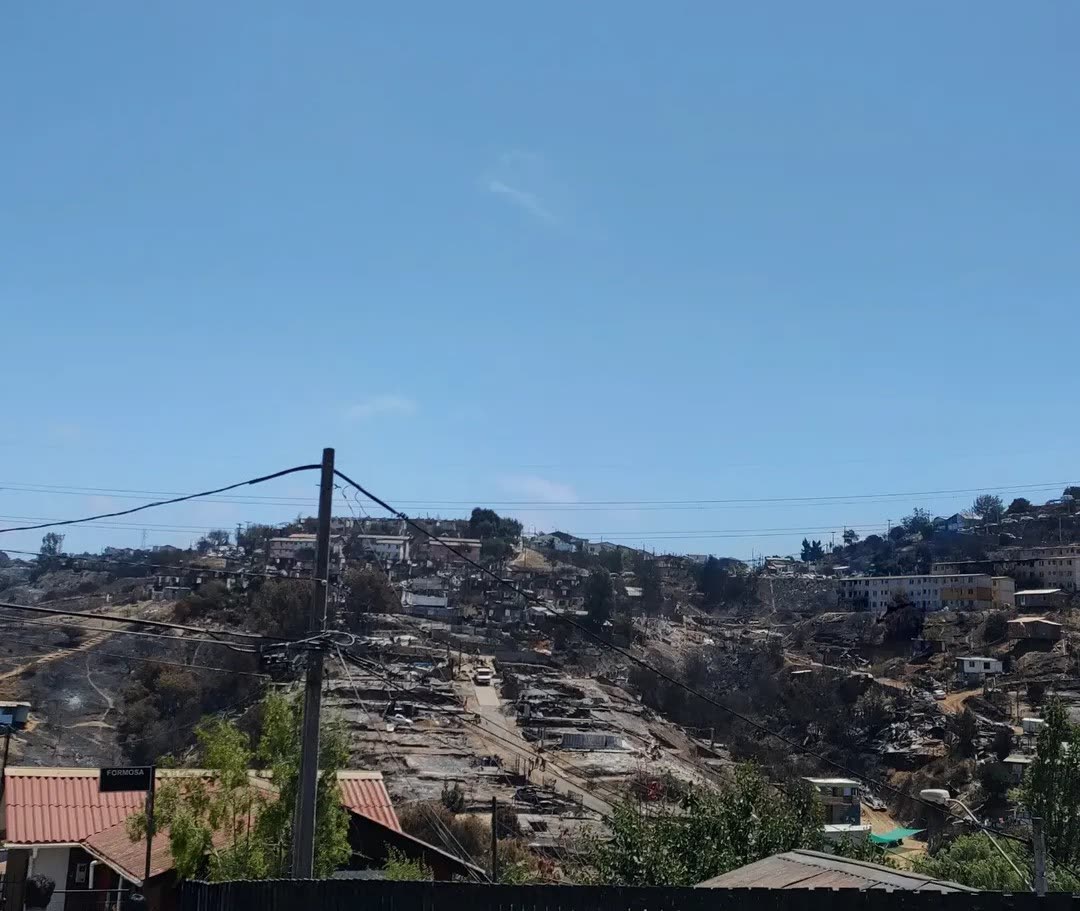
05 · Awareness and memory · Remember
Every big fire leaves lessons that fade within a year. Theyt keeps them visible.
El Olivar, Feb 2024 · Theyt team
How it works
01 · Prevent
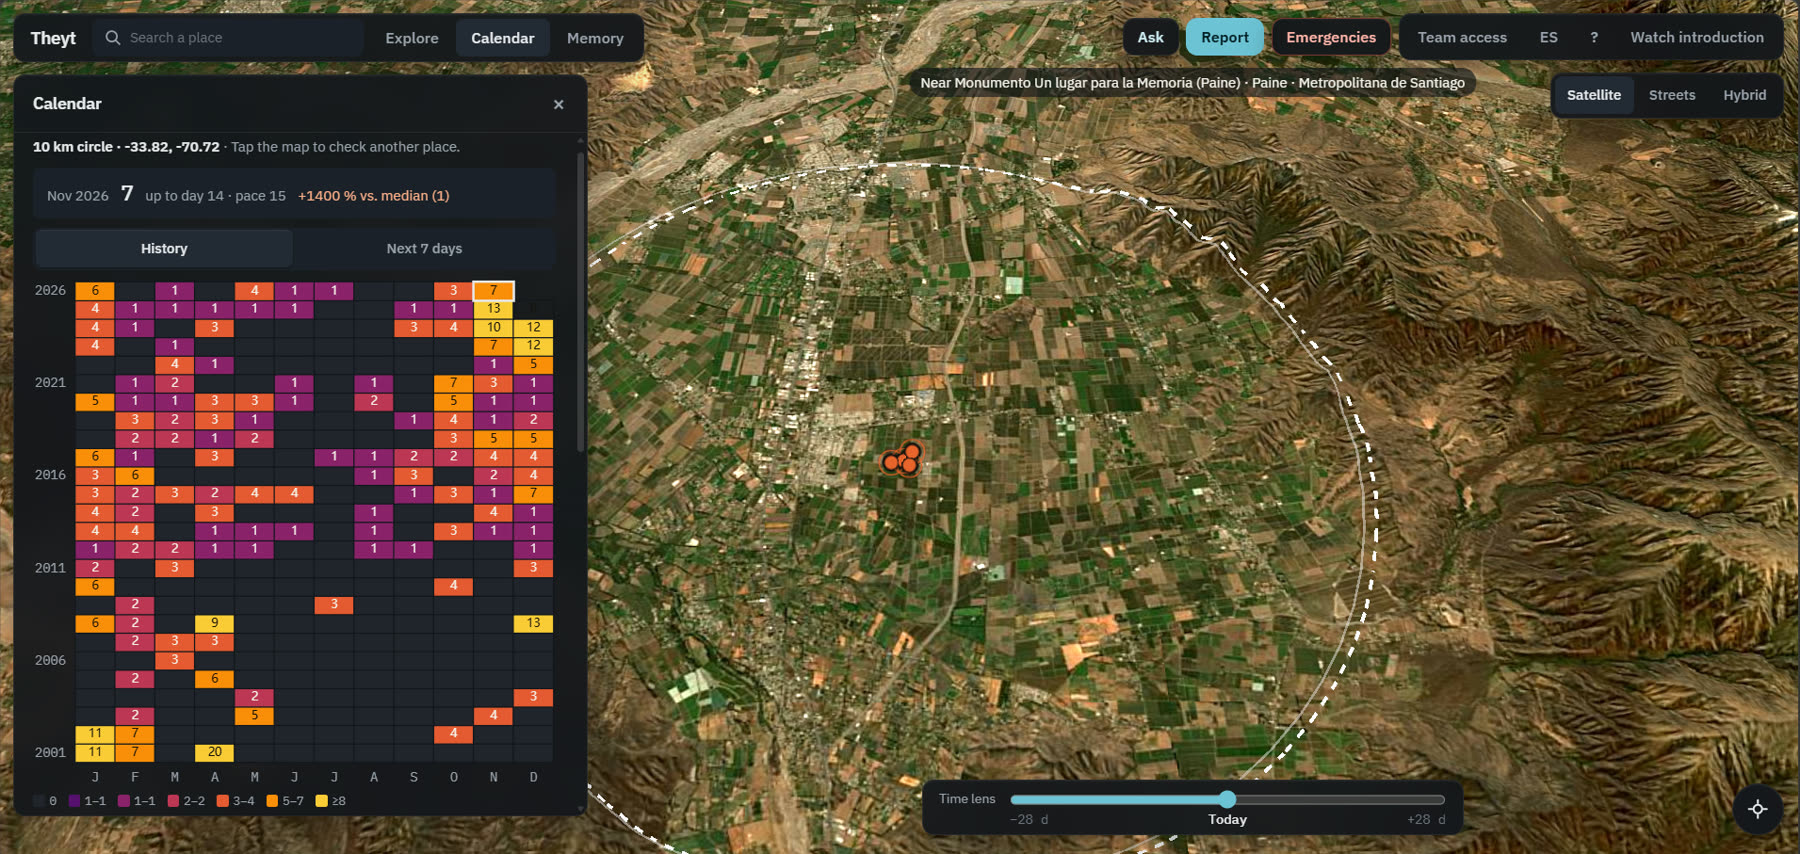
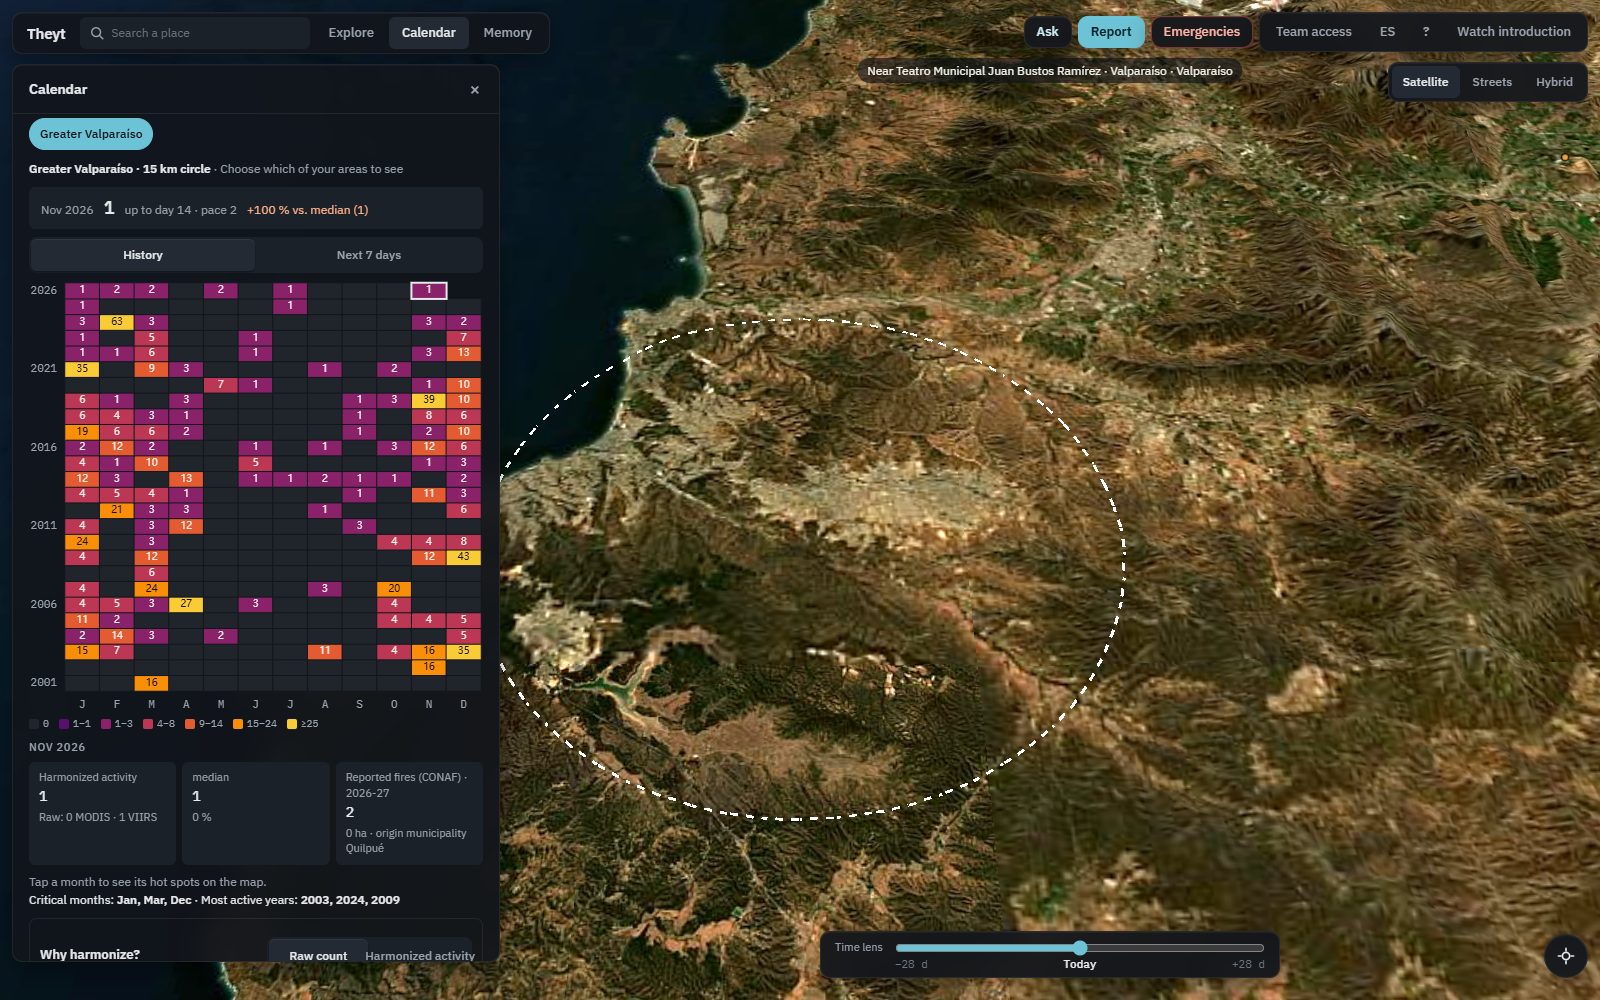
Pick your town, your farm or your brigade's area and see every month since 2001. Which months burn, which years were worst, and whether this month is already above normal. Save up to five places and come back anytime.
02 · Respond
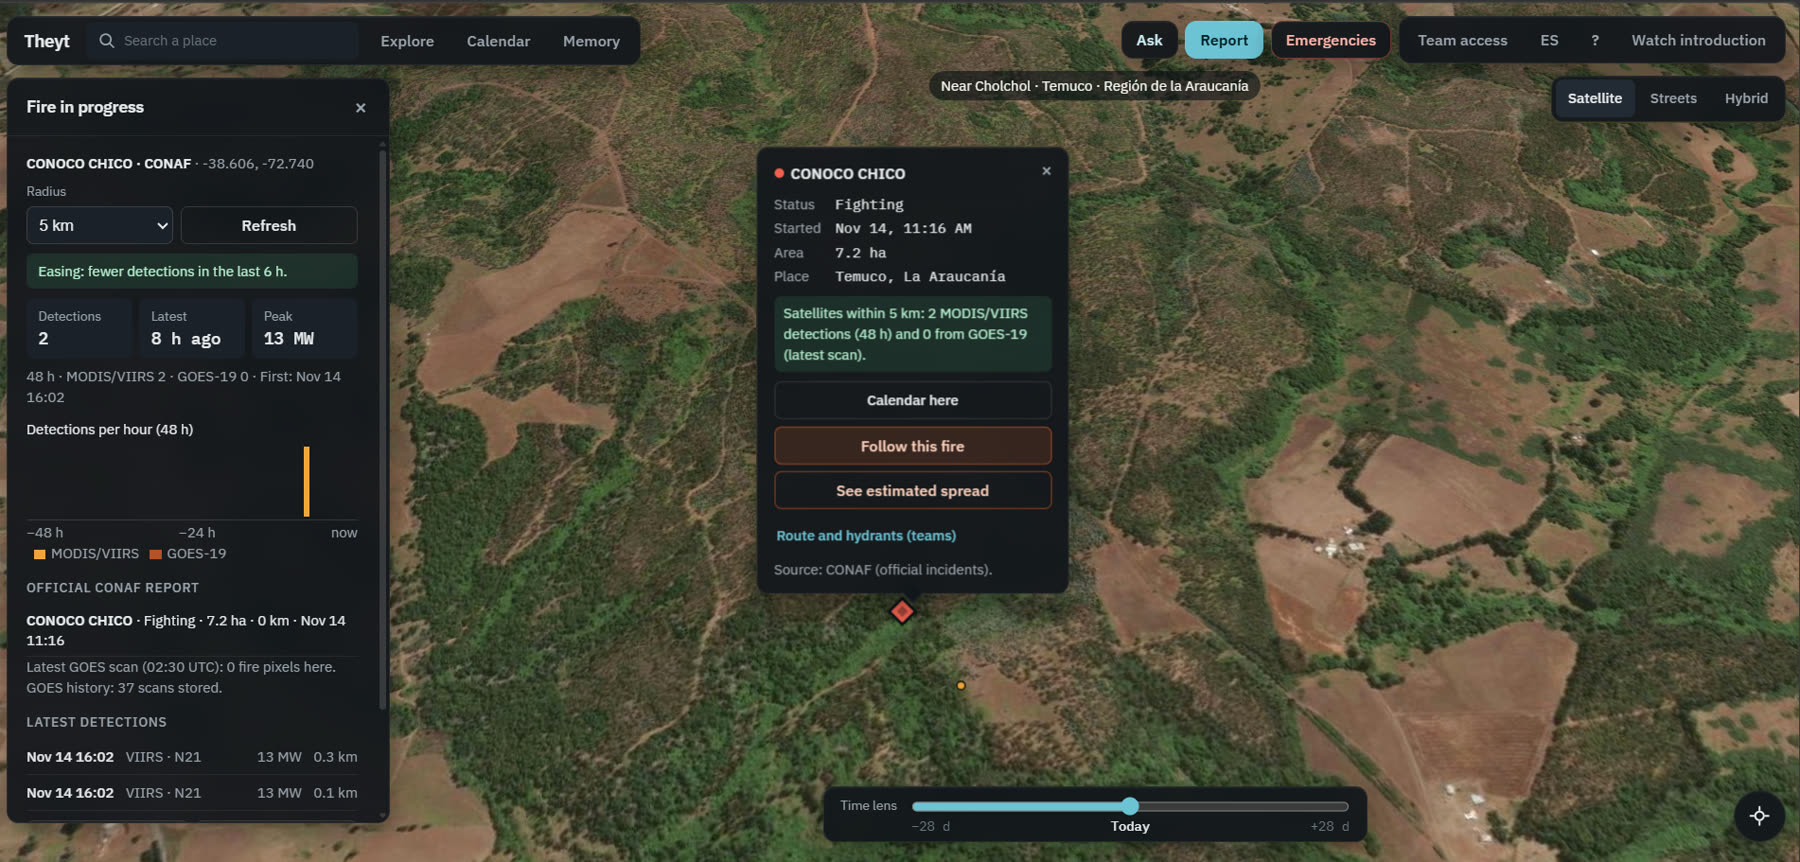
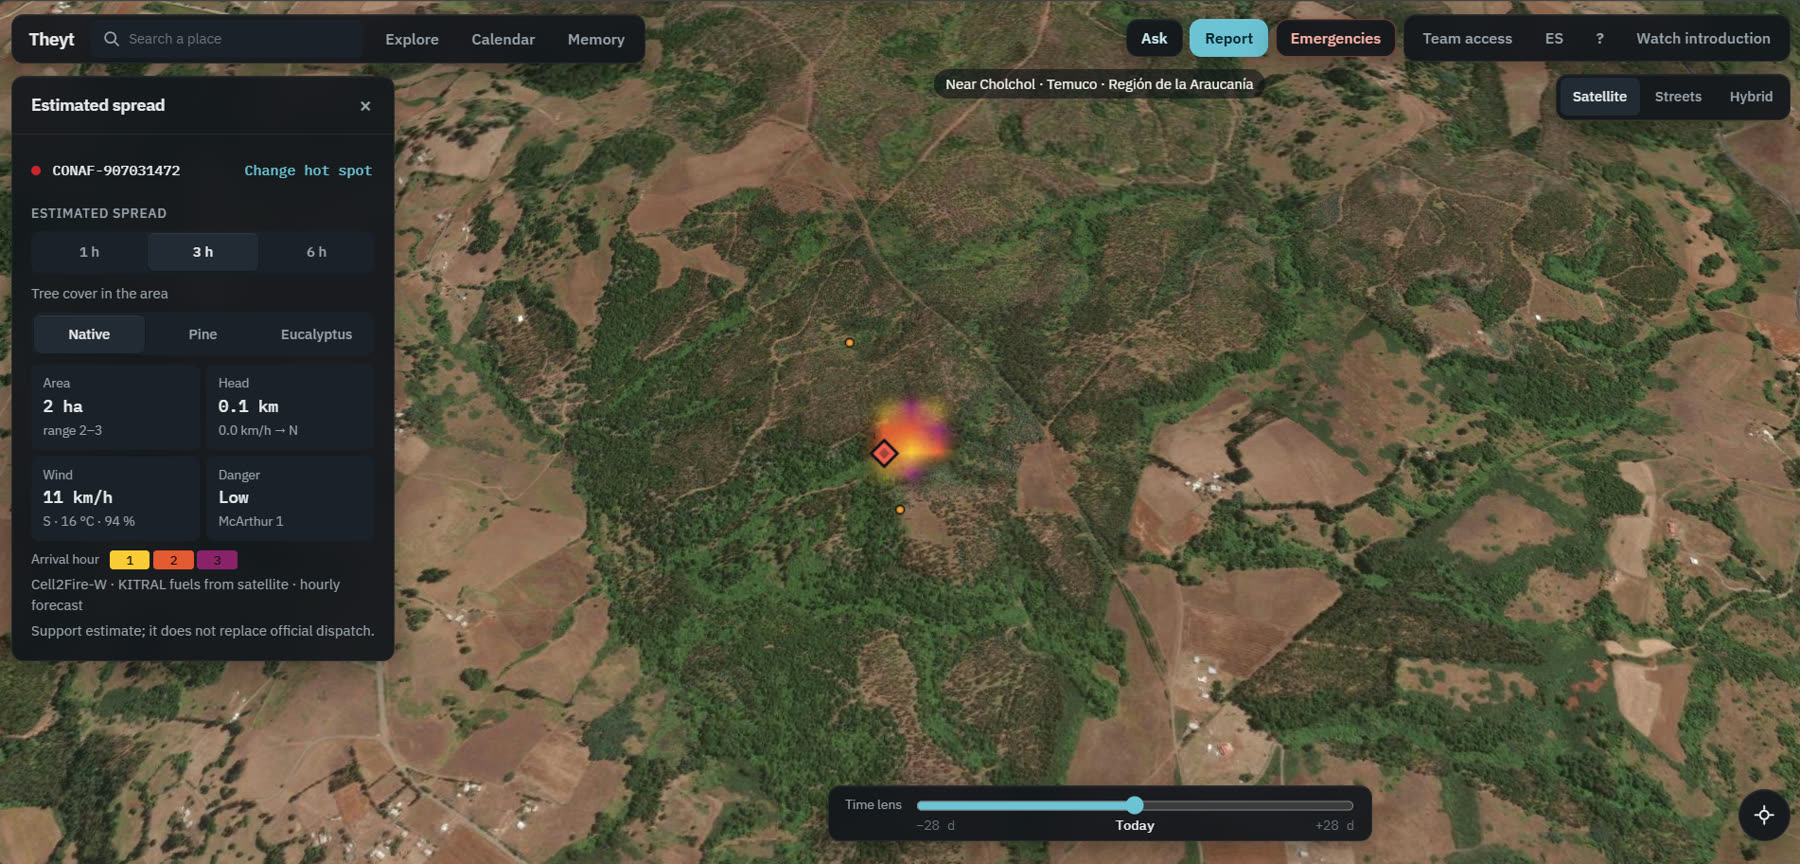
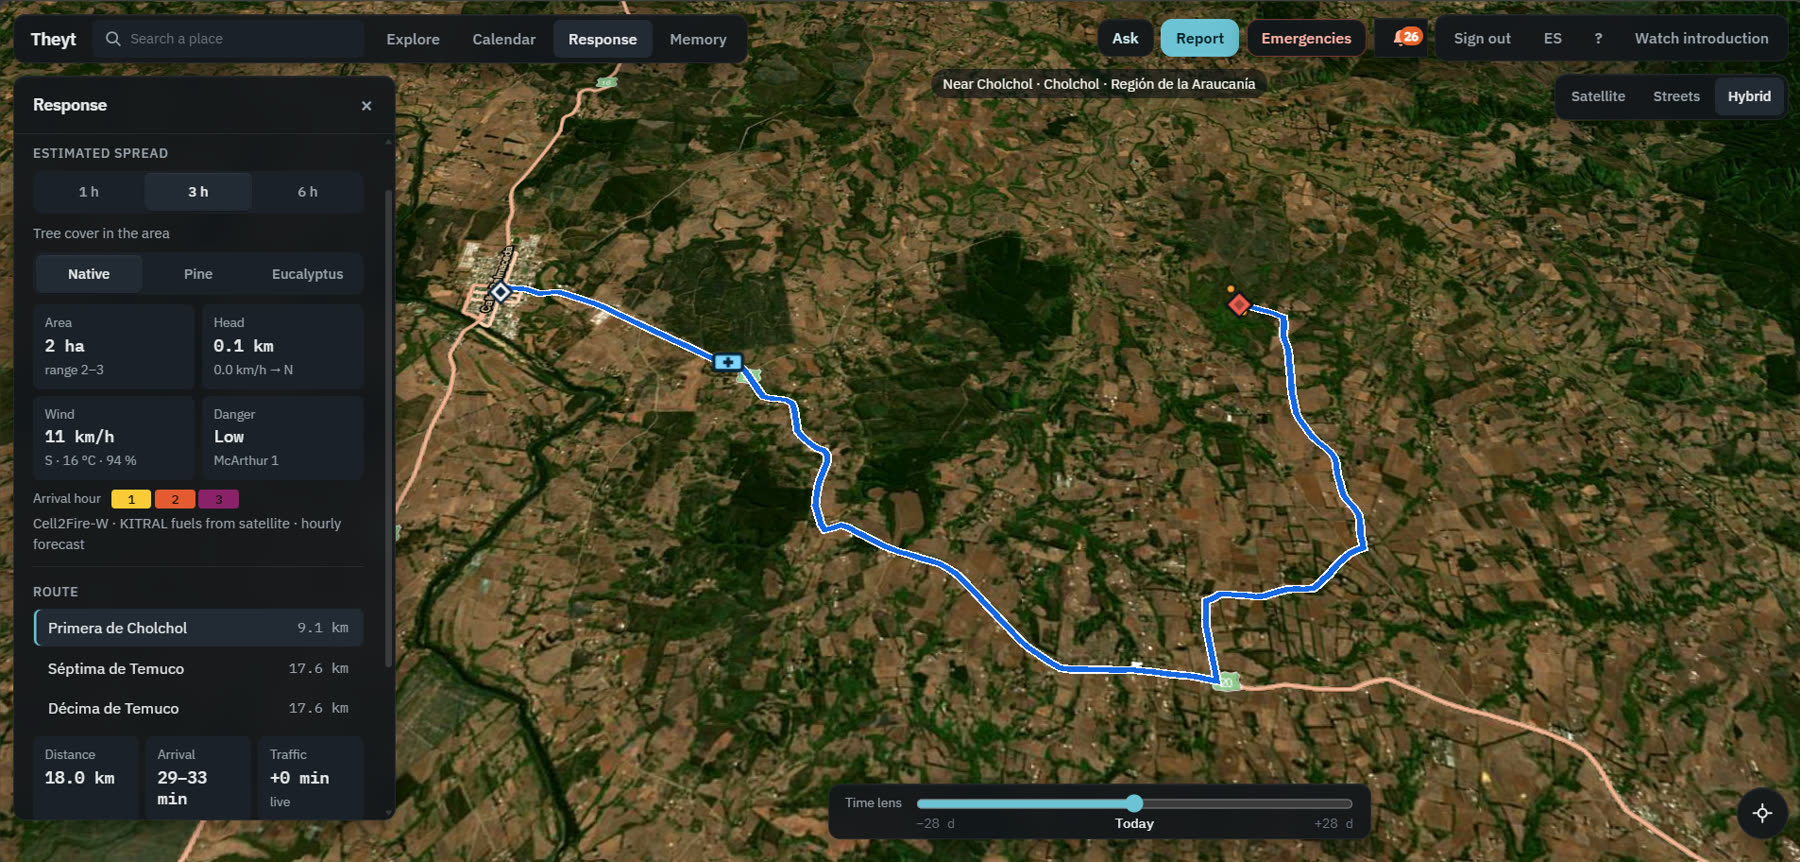
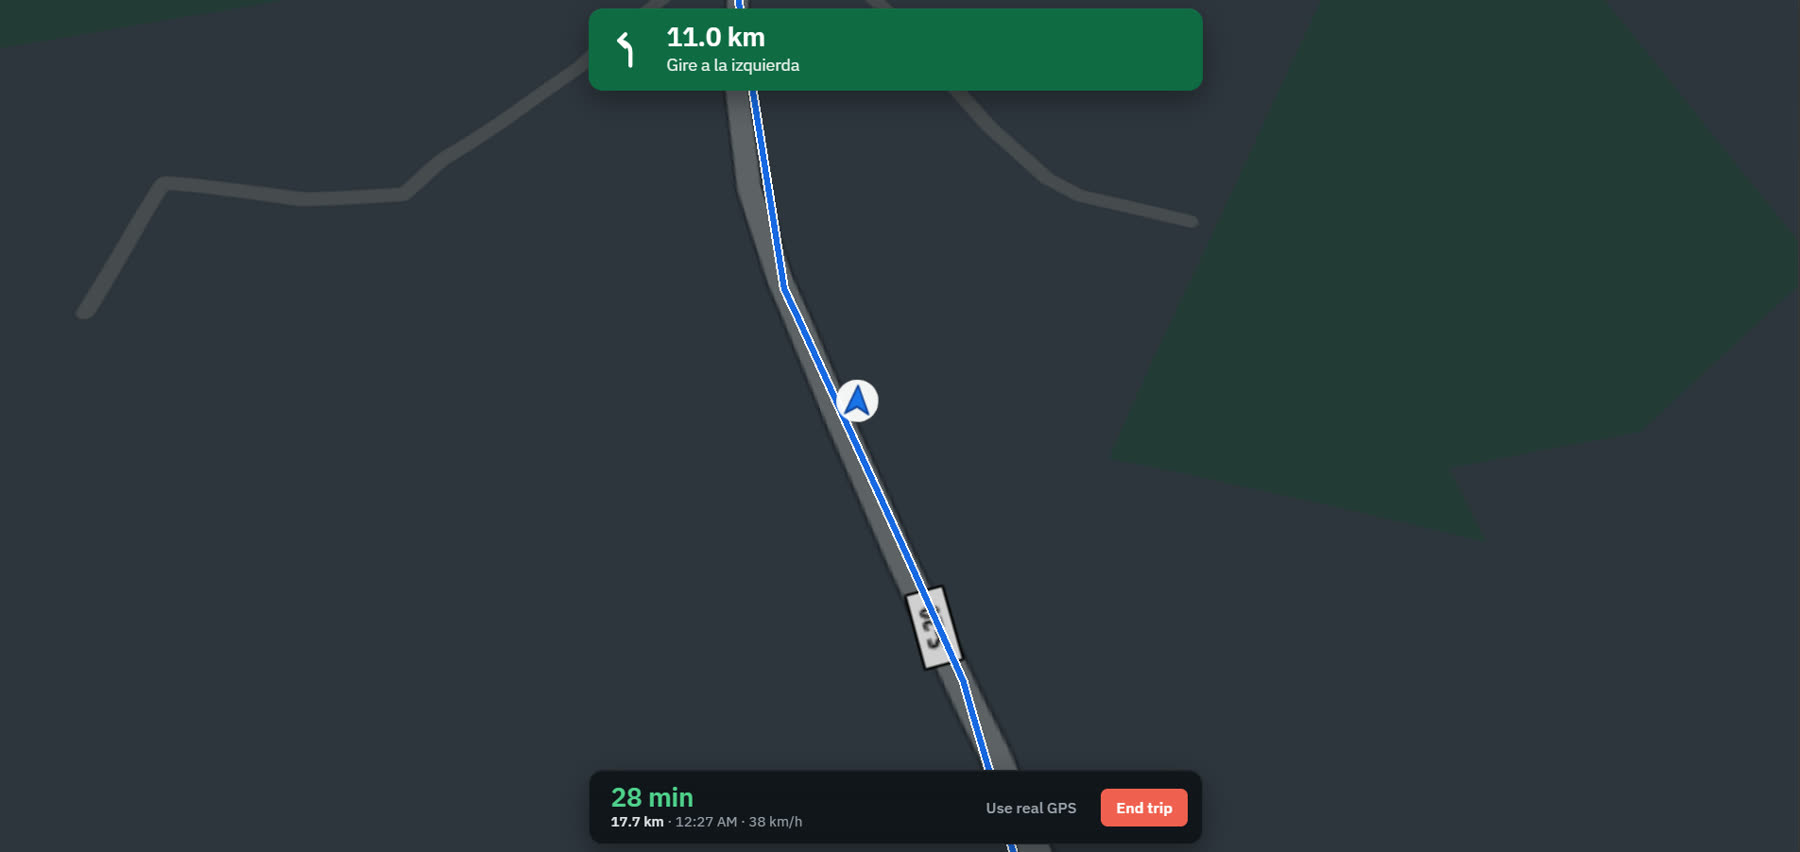
Live fires in Chile and Argentina, refreshed every few minutes and sorted by our engine into real wildfires, burns and false alarms. Follow a fire as it grows, see where it could be in the next hours and get the fastest way there.
03 · Remember
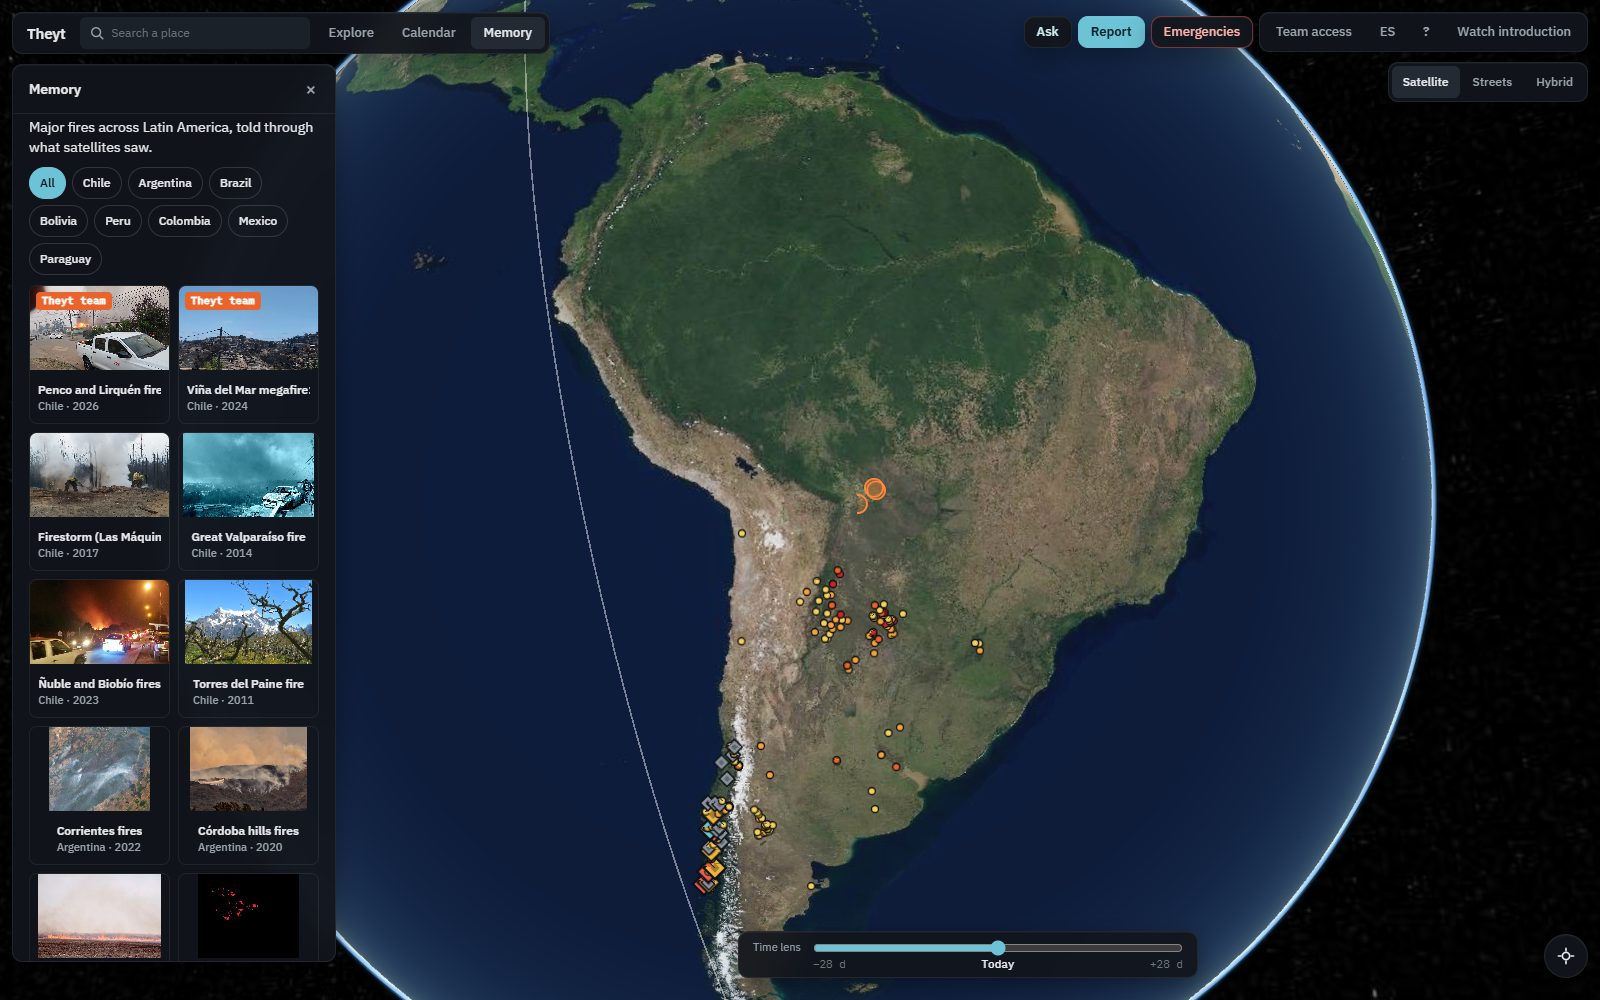
Reports from people with photos and video, kept by date and place. Every big fire keeps its before, during and after, so the lessons do not fade.
Plus · Ask the map
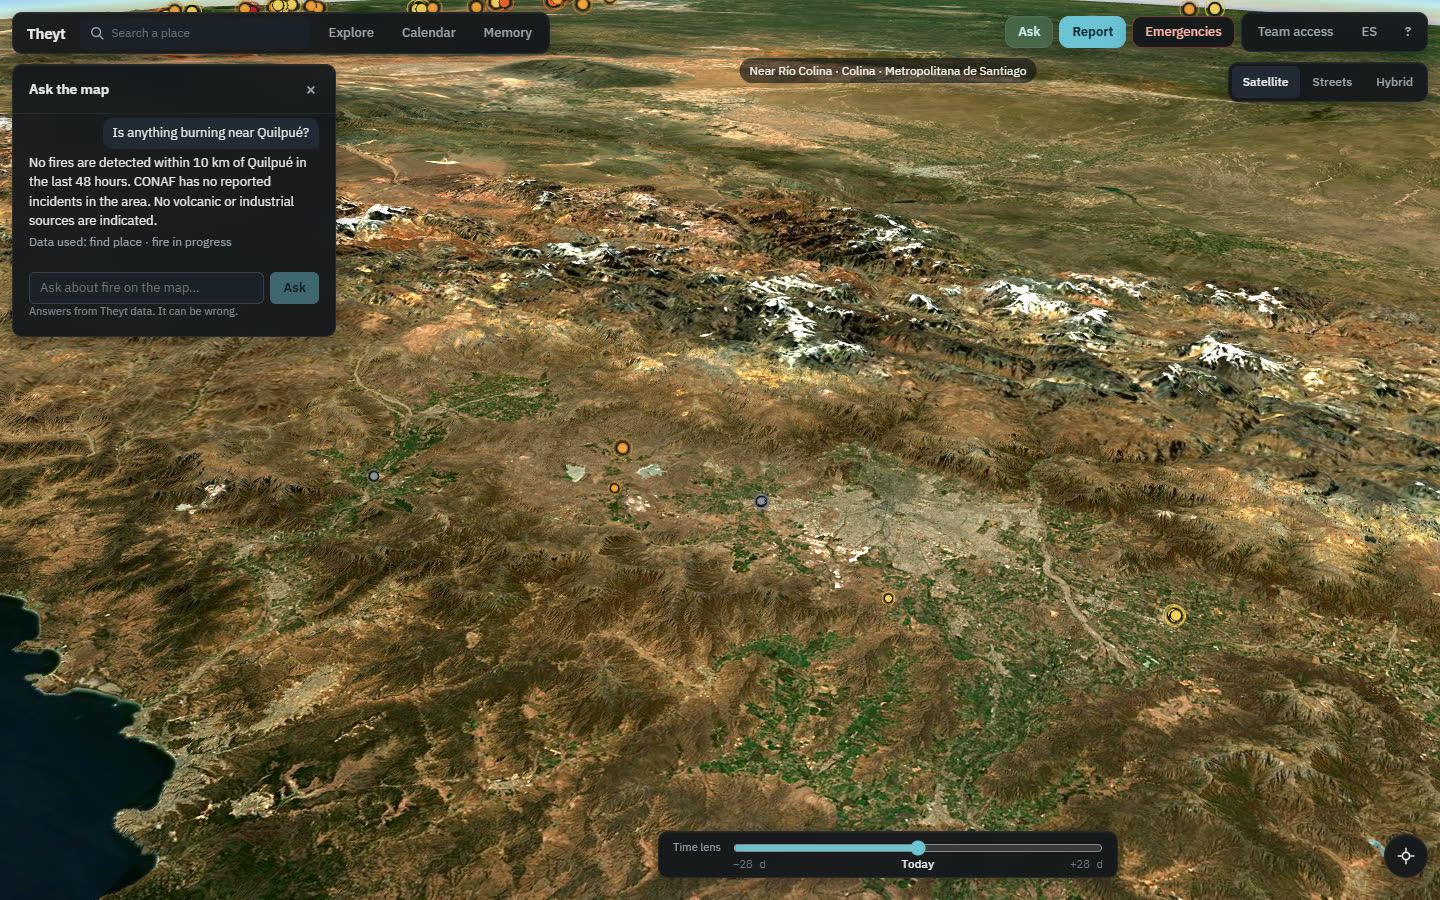
"Is anything burning near Quilpué?" "Is this month worse than normal here?" Theyt's assistant answers in plain words, only with our own data for that place, so anyone can use it without reading a single chart.
The Theyt engine
Others show the dots. Theyt reads them. Six pieces of our own turn every satellite pass into something you can act on, each one tested on data it had never seen.
Old and new satellites put on the same scale, so any month since 2001 compares with today.
A volcano, a smelter or a pulp mill also look hot from space. Theyt checks each hot spot against 25 years of its own place.
The chance of fire in each place over the next seven days, against what is normal for the date.
Hot spots grouped into fire events and sorted into likely wildfires and farm burns, learned from thousands of real fires.
Where a fire could be in 1, 3 and 6 hours over the real land, and the fastest way there from the nearest station.
After the fire, the scar measured on real images, kept only where satellites saw flames.
| A typical fire map | Theyt | |
|---|---|---|
| Hot spots | Every dot looks the same | Real fire, burn or false alarm |
| History | Split when satellites change | 25 years on one fair scale |
| Next hours | Not shown | Spread and fastest route |
| People | Watchers | Reporters, with review |
| Questions | Read the charts yourself | Ask in your own words |
| After the fire | Forgotten | Kept in memory |
The challenge
An older satellite and a newer, sharper one see the same planet with different eyes. If you just count, fire seems to double in 2012. Theyt puts both on the same scale, so what you see are real patterns, trends and anomalies.
Memory
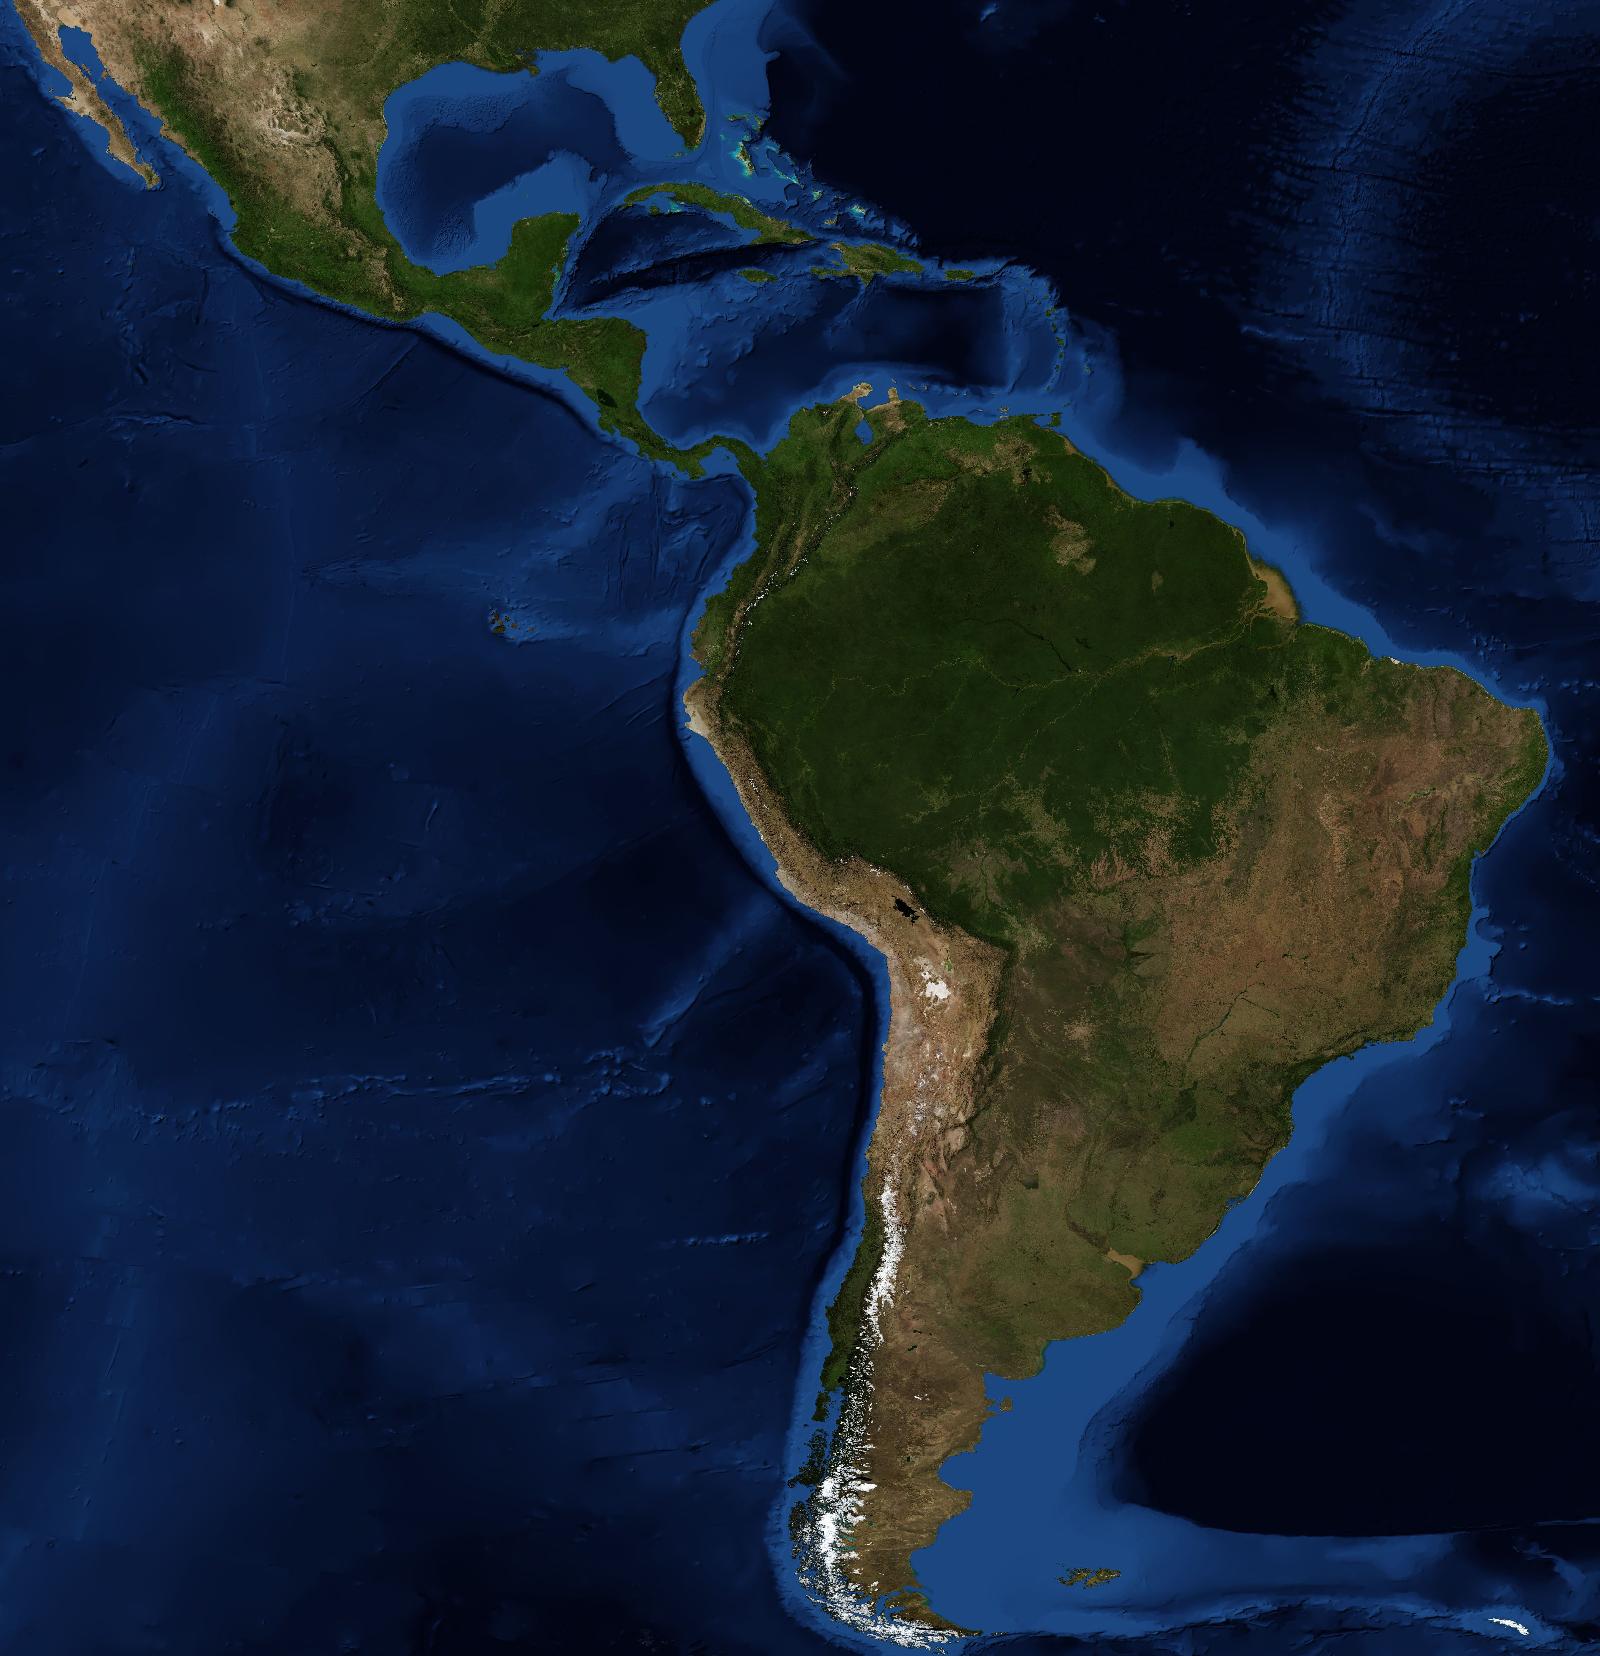
Major fires in the region, verified one by one: the day they peaked and how the land looked before, during and after.
Developers
The Theyt API gives you what our engine produces, not raw feeds: fires already sorted, one fair record since 2001, this week's danger and the full picture of a fire in progress. JSON or CSV, free, no key.
GET /v1/todayFire events right now by country, each one sorted into likely wildfire or burnGET /v1/detectionsLive hot spots with our score: real fire, volcano or industryGET /v1/calendar?lat=&lon=&km=One fair monthly record of fire since 2001 for any place, with what is normal for each monthGET /v1/calendar.csvThe same series as CSVGET /v1/hotspots.csv?…&from=&to=Every fire in an area and date range, cleaned and on the same scaleGET /v1/dangerChance of fire for the next 7 days, against normal for the dateGET /v1/incident?lat=&lon=&km=A fire in progress in one answer: how it grows hour by hour and whether it is a real wildfireTry it
curl "https://mapa.theyt.app/v1/calendar?lat=-33.05&lon=-71.40&km=10"Fair use: 60 requests per minute. Please cite "Theyt". Full reference: GET /v1.